Thoughts on the ocean, the environment, the universe and everything from nearly a mile high.

Panorama of The Grand Tetons From the top of Table Mountain, Wyoming © Alan Holyoak, 2011

Thursday, May 31, 2012

Are you an environmental activist?

In some circles "environmental activist" are fighting words.  Don't ask me why...they just are.

I am a normal guy...relatively speaking.  I have never participated in an environmental protest or rally, taken direct action against any individual or company because I felt that they are acting environmentally irresponsible, or done anything like that.  Yet, I am an environmental activist.  I admit it, happily!

Are you one too?

Before you reach for your gun, consider this.

I am a marine biologist by training and a college professor by occupation.  Over my 20+ years teaching at the college/university level I have spent my time teaching courses that focus on the diversity and ecology of life on earth, as well as courses that either focus on or include attention to environmental topics and issues.

Because of that background, I am sometimes asked to talk to public school groups, campus student groups, and even Church groups or Boy Scouts about the environment and environmental issues.  In many cases these groups are not likely to consider themselves to be environmentalists or even environmentally friendly.  When that happens, what do you do?  I'll tell you what I do...I make a statement and then I ask a few questions.

First of all, I tell the group that I'm highly confident that almost everyone in the room, if not everyone in the room, is an "environmental activist."  It's fun to see the reactions to that.  Some people become immediately offended and want to argue right off.  But, rather than do that, I just ask the group to consider a few questions, and I ask them to raise their hand if they have ever done any of these things:

  1. Have you ever recycled anything?
  2. Have you ever picked up trash that was not yours or that was not on your property and thrown it away?
  3. Have you ever made a conscious decision to walk or ride a bike rather than drive your vehicle to get someplace?
  4. Have you ever taken a short shower or turned the water off while shaving or brushing your teeth in order to conserve water?
  5. Have you ever made a decision as a consumer to buy a particular product because it is more environmentally friendly than the alternative? (Think dolphin-safe tuna, or products made from recycled materials, etc.)
  6. Have you ever made a decision as a consumer to not patronize a particular company or store because you do not consider them to be environmentally responsible?
By the time I've asked the first 2-3 questions just about everyone in the room has raised their hand at least once.  After I've asked the questions I stop, shrug my shoulders and tell them, "I'm sorry, but if you raised your hand least once, you ARE an environmental activist."


It then gets REALLY interesting.  I explain that all it takes for someone to be an environmental activist, in my opinion, is for them to make any active decision that is environmentally friendly.  I'm not saying that people are environmental extremists or eco-terrorists, just that they may be more of an environmental activist than they previously thought they were.  It's fun!

In my opinion, everyone should be an "environmental activist", at least as I define it.  If we can do something that benefits the environment, we should do it.  When large numbers of people do the small things we can all do, it adds up.

So, ARE you an environmental activist?  I'll bet you are!

Here's to environmental activists everywhere!  Including you!

Tuesday, May 22, 2012

The Joplin, MO, tornado struck one year ago today.

One year ago today an EF5 tornado tore through Joplin, Missouri.  The loss of life and property was devastating!

The St. John's Hospital in Joplin suffered significant damage from the tornado.  The hospital is shown in the background.  Most of the windows were blown out, and there was massive damage.  Yes, that's a helicopter in the foreground, possible a medivac rescue helicopter.


This is a closer view of one wall of the hospital showing the windows that blew out when the tornado hit.


This video footage is from a security camera inside the St. John's Hospital, and it captured what it would have been like to be in that waiting room when the tornado hit.  This video was posted today, one year after the tornado struck, by the Huffington Post (Huffington Post Joplin, Missouri, Hospital video footage, 22 May 2011).


For more info on this tornado and why tornados tend to form in the Great Plains and Midwest you can check out a posting I made a few days after the tornado struck back in 2011.  You can see it at Thoughts on the Joplin, MO, and Longdale, OK, tornadoes.

So what's happening with the Arctic Ocean melt, May 2012?

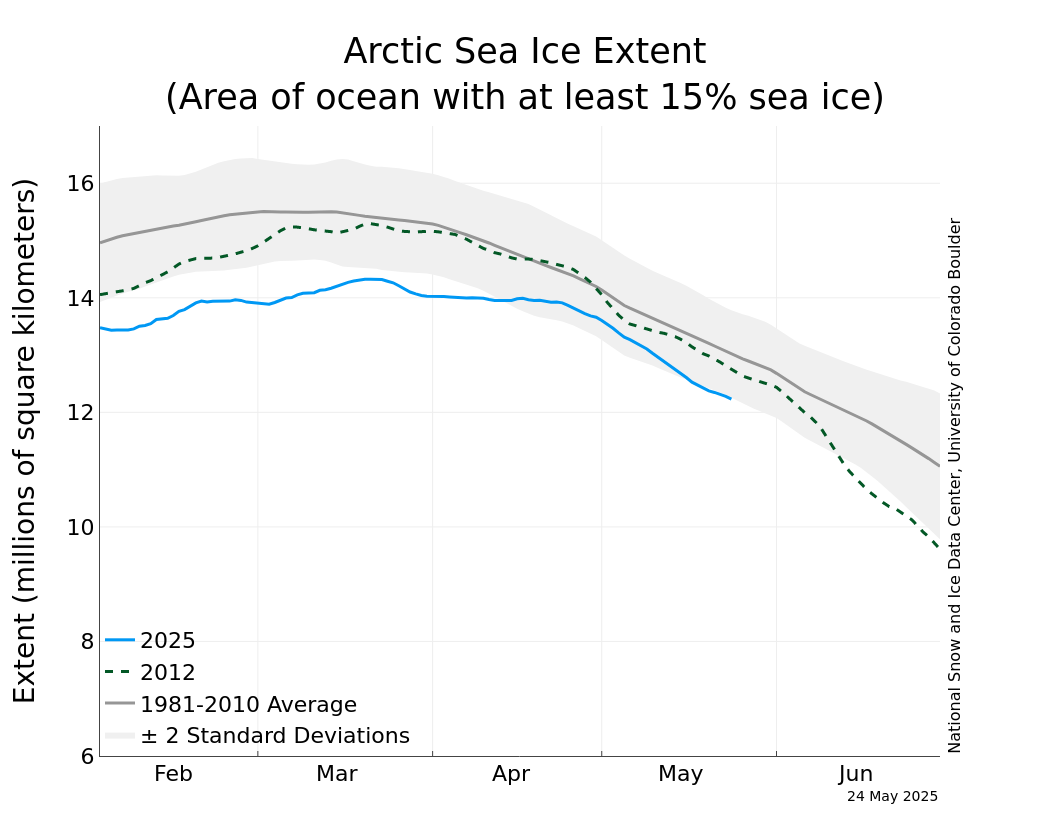
The annual Spring-Summer Arctic Ocean sea ice melt is well under way.  Like the past several years, the sea ice extent is below the historical average, though by the end of April the ice extent was still the greatest we've seen for this time of year since 2001.  Even so the NSIDC reported that the rate of ice loss is 2.6% per decade.  In other words...there's less ice up there than there used to be at this time of year, and every year there's getting to be less and less of the the floating white stuff!

The Arctic Ocean sea ice reached its maximum extent in mid to late March of this year.  The only time in the last five years when the sea ice extent was this large this late in the spring was in 2010 when it reached it's maximum in at the very end of March/very beginning of April.

Graph courtesy of the National Snow and Ice Data Center at the University of Colorado at Boulder. (NSIDC).  

The reason the sea ice extent is so large this year is that we have had colder than average conditions in the North Pacific.  The white area on the map below shows the extent of sea ice cover (at least 15% cover) as of 5/21/2012.  The orange lines show the 1979-2000 average extent of sea ice.  


Take a look at the Bering Sea, west of Alaska and north of the Aleutian Islands.  There's a LOT more ice there than usual.  The same thing is true for areas west of the the Kamchatka peninsula by coastal Russia and north of Japan.  In the north Atlantic, however, the melt is near normal by eastern Canada and Greenland.  It's ahead of normal, though, north of Scandinavia and northwest of the Kara Sea.  

I can't imagine that the ice in the north Pacific is going to last that much longer, but we'll just have to wait and see.

The take-home message?  The melt is underway, and though it's been slower than usual for May, it's still melting faster than average over all.


Tuesday, May 8, 2012

Trees and bees

I had some sadness and some gladness this week.

First the sadness...

My office window looks out across the university campus where I teach.  In the distance I can see mountains that are often snow-topped - nice!  My immediate view, though is made up mainly of a parking lot, a street and a round-about, with a large auditorium in the immediate background.  I can also see part of a green space plus a strip of grass between a road the parking lot in the foreground.

Something was different when I looked out of my window on Monday morning.  It took me a few seconds to figure out what it was though.  Then it hit me - someone had cut down four LARGE blue spruce trees that used to line the street that runs past my building!  The blue arrows in the photo below show about where the ex-trees lived, and they were about as tall as the arrows too.


(I apologize for the grainy photo...the only camera I had was on my computer and I was balancing it with  one hand while I reached down to click the mouse to take the photo...heh heh, no, really!)

There is a new steam line being installed along the right-of-way of the road, and the trees were, alas, in the way.  I am not judging whoever made the decision to cut them down, but it made me sad to see them go.  It's like losing three friends I've had since I got here 10 years ago.  Sigh.

Maybe they've gone to tree heaven.

I know that sometimes a tree just has to go.  They can get too large, too unstable, or diseased and a hazard.  These were, as far as I know, healthy trees...they were just in the way.  Now they are gone, and it makes me sad.

I wanted to know how old they were, so a colleague and I went down there and counted the rings on one of the stumps that was still in the ground.  We counted about 40 rings.  This means that they were probably planted there around 30 years ago.  Sigh.

Now the gladness...


There are two apple trees in our back yard.  I whacked them back quite a bit last winter before the sap started to flow, and I wondered if they would blossom this year.  One tree pushed out only a few blossoms, but the other tree is completely covered!  It's a thing of beauty!


A couple of days ago though, we had a spring frost.  It was 27oF, and I worried that the blossoms would freeze and drop to the ground, and that we'd lose our harvest.

In the afternoon of the next day I went out and walked around the tree.  The edges of the blossoms were slightly curled - caused by the frost - but then I stuck my head up into the tree near the trunk, and heard one of my favorite sounds from nature - bees.

I stepped back and soon saw the bees.  The bees flitted from flower to flower and their pollen sacs were getting full.


I don't know if you know this, but these gatherer bees could mostly care less if you get close to them.  You can get right next to them and watch them work.  It's awesome.

I know at least that there was something in the flowers that attracted the bees, now only time will tell if the flowers avoided enough of the frost to set fruit.  But either way the bees were there, and that was one more thing right with the world.

Trees and bees...

Saturday, April 21, 2012

What's Woola? (Movie monster exposed)

Not too long ago I saw Disney's "John Carter", and I have to say that I really liked it...even the second time I saw it.  One creature in the film is actually quite endearing...it's Woola.


Check out the following clip if you're not familiar with the movie or the creature.  It's got a large head, broad face, and 3 pairs of legs.

http://www.youtube.com/watch?v=egrq2rX8J4s&feature=youtu.be

Like most other Hollywood movie monster/alien creatures, Woola is a mixture of other living things because, frankly, we're not all that creative...sigh.  To me Woola is a mix of salamander, bulldog, and water bear...read on.

If you look at the video again you will see the shape of Woola's skull is clearly giant salamander (these live in Japan).


The inside of Woola's mouth is also VERY amphibian-esque.  Amphibians (and many fishes) have teeth that line the jaws plus vomerine teeth.  These are prickly extensions of the bones that make up the roof of the mouth.  You can see both kinds on the upper jaw and roof of the mouth of a couple of kinds of salamanders. 


The image below shows the inside of Woola's mouth, complete with vomerine teeth - but while amphibians have these teeth only on the roof of their mouths, Woola has them top and bottom:


What about the rest of Woola's body?  It's eyes are WAY bigger than those of a salamander, and it has a profile that reminds me, at least, of a bulldog.


The flat face, the split jowls, protruding teeth, and apparently smiling face...pure bulldog, and pure Woola!

OK, the salamander/bulldog combo explains the head...what about the rest of the body?

To me the rest of the body resembles a microscopic animal called a "water bear" (a.k.a. Tardigrade).  A tardigrade has four pairs of appendages and lives in water, even thin layers of water on mosses.  Here's what tardigrades look like:


All you have to do is remove the last pair of legs, add a tail, a salamander skull, the modified face of a bulldog, leathery skin of a dinosaur, and you've got Woola!


Don't get me wrong...Woola rocks!

Friday, April 20, 2012

We are FAT!!!

A number of years ago I spent a couple of years living in Japan.  I remember walking off of the plane in the Narita International Airport, looking around and being struck by the thought, "Everyone here is Japanese!"  "Helloooooo! It's Japan!!!

Anyway, two years later (and without any trips back to the USA in the meantime) I boarded a plane without even noticing that everyone around me was Japanese...I'd gotten used to that fact long before.  I flew non-stop to San Francisco.  When I walked out of the jetway and into the terminal I looked around and my first thought, and it was a true shock, was, "Everyone here is FAT!"

I wasn't prepared for that!  And you know what?  Things have only gotten worse along our national waistline since then.  

Where did this thought come from?  Earlier today I was looking over some data from the UN Population Division and the World Health Organization (WHO).  

The WHO reported the following numbers for adults globally who are "overweight":


While the number of overweight adults was increasing so was the total global population, so I was hoping that the percentage of people overweight was not changing.  Here's what I found out:

Year             Global Population            Overweight Adults       Percentage
2002                   6.2 billion                         1.454 billion                  23.5%
2005                   6.5 billion                         1.602 billion                  24.6%
2010                   6.97 billion                       1.934 billion                  27.7%

Argh!!!!  We are getting fatter and fatter even as our population is growing!

That's a snapshot of the world, but what about the USA?  How are we doing?  

Are we really as fat as I thought we were when I walked off of that airplane way back when?

Here are some national data from the WHO.  These data show the percentage of the population that is overweight in the ten richest countries and the 10 poorest countries in the world:


All I can say is that Americans like to be winners, and there we are, the 6th richest country in the world, and we have the highest percentage of overweight adults of any of the countries listed.

So, yes, we are FAT!!!!!

How are you doing?  How can you know if you are overweight?  

You can check that out by looking at a chart showing BMI values.  That's "Body Mass Index".  It's a function of your height and mass.  These values are calculated using this formula (if you start with weight in pounds and height in inches):


Here's a BMI chart for men:


Here's a BMI chart for women:


It's actually a very strange conundrum.  Americans praise and admire people who are fit, trim, lithe.  But as a people we are...FAT...FAAAAAAAAAAAAAAT!!!.  How did this happen?  It's no real mystery.  Over the years we have become less active and we have had access to increasing amounts of fatty, salty, sugary, rich processed foods that we have helped ourselves to again and again and again.  So now we are FAT.

What's the solution?  There's really only one sure-fire way to become un-FAT.  That's to burn more calories than you take in.  The most reliable way to do this is to make lifestyle changes...changing diet and activity levels.  

Here's to reversing the trend!

Thursday, April 12, 2012

March and Winter 2012 Weather Summary - Thanks Lee!


The data below are excerpts from the March 2012 monthly weather summary by Lee Warnick for Rexburg, Idaho.  He is a member of the Faculty at BYU-Idaho, a National Weather Service (NWS) weather spotter, and avid amateur weather observer.  He compiles and emails these data to people who signed up to receive it (you can find links to the group at the end of this posting).  

The data come from the NWS and his own weather station.  

****************************************************************

••• March 2012 almanac •••
Average highs: 50.0     Normal: 44.9     Departure: +5.1
  Notes: 8th mildest March highs in 41 years and mildest since 2007;
breaks run of 4 cooler-than-normal Marches; 4th straight month overall
with above-normal highs

Average lows: 29.0     Normal: 23.7     Departure: +5.3
   Notes: 2nd mildest March lows in 41 years, next only to 1986
(29.1); 3rd consecutive month overall with above normal low temps

Highest temperature: 72 on the 31st
Lowest temperature: 1 on the 2nd

Precipitation: 1.17     Normal: 1.00     % of normal: 117
     Notes: 3rd of past 4 Marches with above normal precip

Snowfall: 7.5     Normal: 5.9     % of normal: 127
     Notes: 11th most March snowfall in 41 years and most since 2008;
breaks run of 3 Marches and 4 months overall with below normal snow

Days with measurable precipitation: 13     Normal: 8.2     % of
normal: 158
High precipitation day: 0.32 inch on the 16th
Days with measurable snowfall: 4
High snowfall day: 2.5 inches on the 1st

Lowest wind chill: 1 degree on the 2nd
Highest wind gust: 48 mph on the 31st
Number of windy days: 14
Days at zero or below: 0     Normal: 0.4
Number of days: cloudy, 6; mostly cloudy, 14; partly cloudy, 4; fair,
7
Heating degree days: 791     Normal: 950
     Notes: 16.8 percent lower heating demands than normal in March

••• March monthly records •••
Highest high temperature, March: 72 on the 31st
     Ties record from March 28, 1986; and March 30, 1986

Highest low temperature, March: 45 on the 31st
     Breaks record of 43 from March 11, 1995; March 24, 1998; and
March 31, 1978

••• March 2012 daily records •••
High temperature: 24th     68     Breaks record of 66 from 2004
High temperature: 25th     69     Breaks record of 68 from 1999
High temperature: 31st     72     Breaks record of 71 from 2004
Highest low temperature, 14th     40     Breaks record of 37 from 2003
Highest low temperature, 15th     41     Breaks record of 33 from 2009
Highest low temperature, 16th     41     Breaks record of 38 from 2009
Highest low temperature, 17th     37     Ties record from 2009
Highest low temperature, 30th     40     Breaks record of 37 from 1978
Highest low temperature: 31st     45     Breaks record of 43 from 1978

No precipitation or snowfall daily records were set or tied in March

••• Annual scoreboard •••
2011-12 water year precipitation – through 6 months: 5.46
Normal: 5.95     % of normal: 92

2009 annual precipitation – through 3 months: 2.89
Normal: 2.80     % of normal: 103

2009 precipitation days: 29     Normal: 26.1     % of normal: 111

2009 heating degree days: 3146     Normal: 3539
   Notes: 11.1 percent higher lower demands than normal to date this
year

••• March 2012 highlights •••
     • Last month I noted that the “high pressure” days had dropped
from 81 percent in December to 71 percent in January, to 52 percent in
February. The percentage plummeted to 23 percent in March, with high
pressure in place no more than three days in a row. We had plenty of
storms pass through the region.

     • Those storms increased in frequency as the month progressed.
Our first two storms were classic Pacific systems that brought
primarily snow. About mid-month the storms started rolling in from a
more southerly orientation and brought mostly rain. And that precip
came in swarms – six straight days of measurable precip from the
14th-19th, and then after a six-day break we closed the month with
measurable precip on five of six days.

     • With the southerly flow came milder temperatures, particularly
at night. We broke daily records for mildest minimum temps on four
straight days (14th-17th), later basked in four consecutive days of
mid-to-upper 60s that included two record-breakers (24th-25th) and
finished March with two more record-breaking days. The 31st was the
mildest March day on record in Rexburg, with a high of 72 (tying a
record set in 1986) and low of 45 (breaking a March record by 2
degrees).

     • Not surprisingly with all these rceords, we were a scant 0.1
degree from breaking the March record for highest average minimum
temperatures. Our maximum temps were above average by more than 5
degrees from the monthly record.

     • Yes, it also was windy, but at 14 windy days still two short of
the March record. So far in 2012 we have recorded 25 windy days. At
this pace we’ll end up with 100; the record, set both in 2010 and
2010, is 95 days.

••• Winter of 2011-12 summary •••
Average temperature: 28.55     Normal: 25.88
Rank: No. 7 mildest in 41 years and mildest since 2002-03
Past four winters: 24.93 (2010-11), 24.57 (2009-10), 26.40 (2008-09),
23.88 (2007-08)

Seasonal snowfall: 30.0     Normal (through March): 55.3
Rank: No. 6 lightest in 41 years and least since 2002-03
Past four winters, through March: 75.9 (2010-11), 52.0 (2009-10), 65.4
(2008-09), 83.6 (2007-08)

Days at zero or below: 5     Normal: 17.6
Rank: No. 2 lowest total in 41 years, next only to 2002-03 (3)
Past four winters: 15 (2010-11), 22 (2009-10), 12 (2008-09), 17
(2007-08)

General snow cover: Dec. 31-Jan. 10 (11 days)
     Notes: This is tough to determine, for we didn’t have consistent
snow cover most of the winter. This was the longest period with
general snow cover.
Final snowmelt from my yard: Feb. 21
     Notes: Again, tough to tell, but this is when all but human-
created piles of snow had departed.
Maximum snow depth: 4 inches on February 1

   Summary: This was far from the La NiƱa-influenced winter we
anticipated. Like much of the rest of the country, we enjoyed mild
temperatures and light snow – barely half the normal amount through
March. November’s and December’s close-to-normal temperatures morphed
into well-above-normal (in January and March) and moderately above
normal (February) temps the rest of winter. After flirting with
records for least amount of seasonal snow through January, we’ve had
near-normal snow since then, though it didn’t usually stick around
long.

••• A strange year, indeed •••
     Exhibit 1: A few weeks ago I was listening to an internet stream
of WBUR from Boston. I thought I heard the announcer state a current
temperature of 82 degrees – in late March! Not possible! I looked it
up on the NWS’ web site, and sure enough, Boston was above 80 a few
days removed from winter. The official high that day was 84 degrees!

     Exhibit 2: I read a story the other day announcing that the
United States was an average of 8.6 degrees above normal for March.
(We in Rexburg didn’t quite pull our weight, coming in at just 5.2
degrees above normal.) This was the warmest March on record
nationally, and not by a small margin.

     Exhibit 3: The wildfire season is starting not in Arizona and
Texas but the Northeast. That’s right – the nation’s biggest blazes
right now are burning in Pennsylvania, New Jersey, Connecticut and New
York, places that might not see major wildfires once in a generation.

••• Looking ahead •••
     Mid-range forecasts have us high (in temps) and dry for the next
few weeks. The latest 30- and 90-day predictions don’t see strong
tendencies in temps but move us toward a dry late spring and early
summer. The long-lead forecasts trend toward a warmer than normal
summer, with lesser tendencies leaning toward drier than normal.

     And one parting note: Our brief appearance on the national
Drought Monitor map is over with for the time being. However, most of
northern Utah still is listed as D1 (Moderate Drought).


--
You received this message because you are subscribed to the Google Groups "Rexburg Weather Group" group.
To post to this group, send email to rexburg@googlegroups.com.
To unsubscribe from this group, send email to rexburg+unsubscribe@googlegroups.com.
For more options, visit this group at http://groups.google.com/group/rexburg?hl=en.