Thoughts on the ocean, the environment, the universe and everything from nearly a mile high.

Panorama of The Grand Tetons From the top of Table Mountain, Wyoming © Alan Holyoak, 2011
Showing posts with label sea ice melt. Show all posts

Friday, July 5, 2013

Holy cow! The 2013 Arctic sea ice melt is accelerating like crazy!

I know I just posted on the Arctic Ocean sea ice melt, but, well, that was three days ago.  And three days ago it looked like an acceleration of sea ice melt might have been on the way, but I'd say that now it's official!  Look at the difference between the 1981-2010 baseline trend and the observed sea ice melt between the latter half of June and July 4th.  Wow!


I did a little math, and here's what I came up with.

On June 21st the historical baseline (1981-2010) showed sea ice extent at about 11.4 million km2 and 10.55 million km2 on July 4th.  That's a difference of 850,000 km2 of sea ice, or a melt rate of about 65,400 km2 of sea ice per day.

By comparison, the observed time period between June 21st and July 4th 2013 showed a sea ice extent of 11.1 million km2 on June 21st and an extent of 9.6 million km2 on July 4th.  That's a difference of 1.5 million km2 over that time period for a daily sea ice melt rate of about 115,400 km2 per day.

The observed melt rate for 2013 over the past two weeks or so is therefore nearly double the baseline melt rate for the same time period.  It's doubtful that this melt rate can be maintained for long, but the next few weeks will give us a good indication about whether the 2012 sea ice minimum extent record is in jeopardy. That is, if the current sea ice melt rate will be sustained, at least over the short term.

So, it's true, things are really starting to warm up in the Arctic.

Stay tuned...it's going to be an interesting summer!

Monday, July 1, 2013

Time to check in on the Arctic Ocean summer sea ice melt - 1 July 2013

It's been a while since I posted anything about what's happening in the Arctic Ocean.  In a word, the summer 2013 sea ice melt is "on".  So far this spring/summer, sea ice cover has declined from a winter maximum ice extent of just over 15 million km2 down to 10.5 million km2 as of yesterday (6-30-2013).

The maps below shows that sea ice melt is progressing much faster than the 1981-2010 average in Hudson Bay, the Barents Sea, Baffin Bay, and other areas around the Canadian Archipelago.  Sea ice melt in the Bering and Chukchi Seas are right on the historical average.


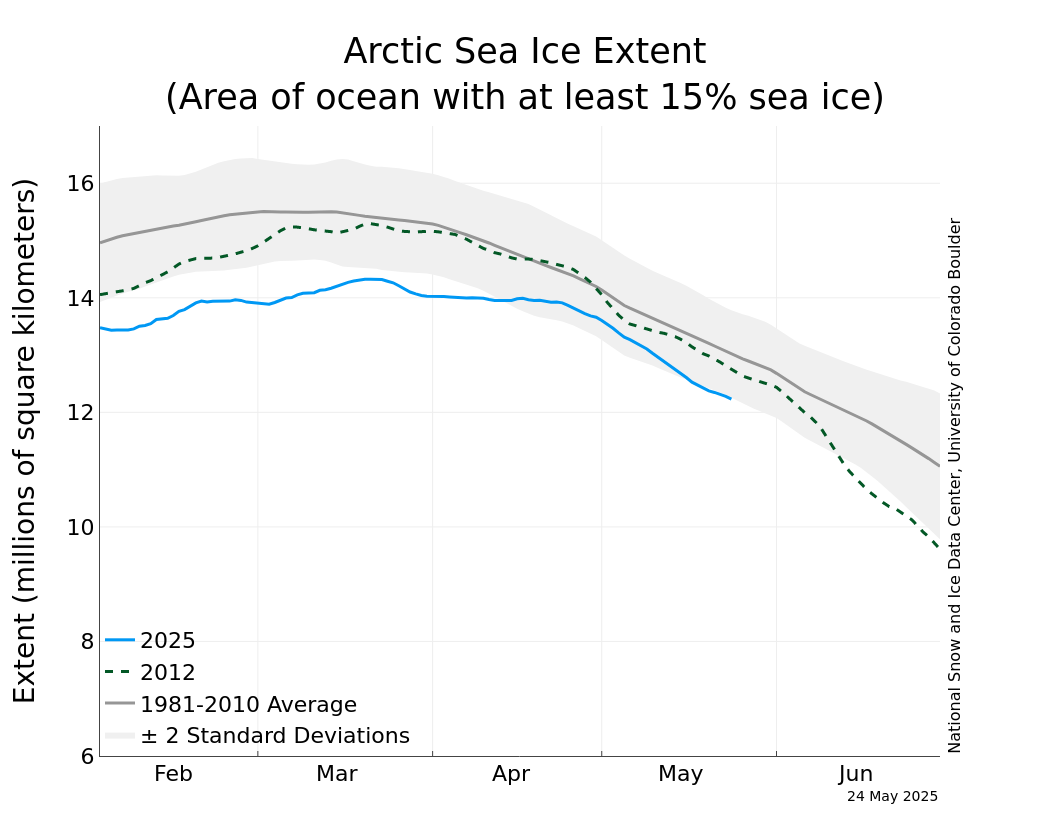
The graph below courtesy of NSIDC.org shows the relationship between the 2013 Spring/Summer melt and that of the 1981-2010 average and the 2012 all time record low sea ice melt.  The current melt is currently about midway between the historic average melt and the record melt for this time of year.  The rate of sea ice melt has really increased (as indicated by the steep downward turn in the blue line on the graph below) over the past week or so.  The rate of sea ice melt will really have to speed up, though, if it's going to have a chance of catching last year's record pace. 


If you follow these kinds of data on a regular basis, like I do, you might be surprised to see the current rate of sea ice melt is as close as it is to the historic rate of sea ice melt.  That's because NSIDC recently updated their baseline data for comparisons from a 22-year average (1979-2000) to a 30 year average (1981-2010), since that is standard practice for baselines whenever possible.  You can read more about that change by clicking this link: http://nsidc.org/arcticseaicenews/2013/06/updating-the-sea-ice-baseline/.  FYI, the NSIDC made this change on June 18, 2013.

So as of now, the 2013 sea ice melt is not threatening to break last year's record minimum sea ice extent.  But the only way to know what is going to happen is to be patient and keep checking back.

Have a great summer, but I hope that not too much sea ice melts!

Tuesday, October 23, 2012

North and South - Climate change and sea ice in the Arctic and in the Antarctic

Record sea ice melting in the Arctic Ocean receives a lot of attention from the media - as far as climate change news goes - but you don't hear that much about what is happening in the Antarctic.

First of all, a quick reminder about sea ice in the Arctic Ocean:

Sea ice melt in the Arctic Ocean in 2012 smashed the previous record by 750,000 km2.  The map below shows the observed sea ice extent in Sept 2012 (white area) compared to the 1979-2000 average extent (pink line)  Wow!  


Sea ice extent is defined as the area of the sea with at least 15% sea ice cover.  The graph below shows the Arctic sea ice extent for the years 2007-2012 and the 1979-2000 average.  Sea ice melt for all individual years shown (2007-2012) have minimum sea ice extents that are significantly (statistically) less than the 1979-2000 average (dark gray line; lighter gray area is + 2 standard deviations around the 1979-2000 average).    The bottom line for the Arctic is that it is warming significantly, and much faster than even the fastest climate models developed to date.

Ok, let's take a look at what's happening in the Antarctic:

The map below shows the Antarctic maximum sea ice extent (white area) for 2012 compared to the 1979-2000 average sea ice extent (orange line).  2012 sea ice extent in the Arctic set a new sea ice maximum record.  The graph below the map shows the sea ice extent for 2012 compared to the 1979-2000 average.


The graph below shows average sea ice extent for the month of Sept for 1979-2000 and for selected individual years.  Interestingly sea ice extent is increasing on average around Antarctica. When we look at data of sea ice cover in recent years in the Antarctic we see that 2006, 2007, 2011, and 2012 all had higher than average sea ice extent maxima but only 2006 and 2012 maximum extents were statistically higher (different) than the 1979-2000 average. With that being said, sea ice extent did exceed the + 2 standard deviation range in 2006 and 2012.  So, what is going on in the Antarctic that is leading to increased sea ice cover?


A report by scientists at the National Snow and Ice Data Center explains very nicely what is happening with sea ice extent in the south (http://nsidc.org/arcticseaicenews/2012/10/poles-apart-a-record-breaking-summer-and-winter/).

Here's a brief summary of their report together with some additional information to increase clarity:
  1. Temperatures are warming in the Antarctic, just not as fast as in the Arctic (the NSIDC cites references you can refer to if you want more info on this.)
  2. Warming of the Pacific Ocean and ozone depletion over Antarctica combine to strengthen circumpolar winds.
  3. The strongest of these circumpolar winds blows east to west, and Coriolis Effect causes these winds to deflect to the left (north).  
  4. The northerly flow of air around most of Antarctica causes sea ice to be pushed farther north than usual, spreading it out and increasing sea ice extent (remember, sea ice extent = 15% ice cover or more)
It would be very interesting to know whether the total amount of sea ice being formed in the Antarctic is increasing or decreasing.  All we know right now is how the ice that is being formed is being dispersed.

In summary:

Sea ice extent around Antarctica is increasing, but it is not increasing because it is getting colder.  It is increasing because winds blowing toward the north are dispersing sea ice farther away from the Antarctic coastline than usual.  Don't forget that sea ice formation in the Antarctic winter is followed by nearly 100% sea ice melt in the Antarctic summer - this is different than in the Arctic where multiple-year sea ice has historically accumulated.  

Friday, August 24, 2012

Are you kidding me!? Arctic sea ice melt is already at a near record level and still going strong

In 2007 the rate and extent of sea ice melt shocked the world of climate scientists.  That year an unusual set of weather events combined to produce a record sea ice melt in the Arctic Ocean.  This year, 2012, that record is almost certainly going to be broken, if not shattered.  What makes this VERY unusual is that the recent conditions in the Arctic, including an Arctic cyclonic storm, normally produce slower sea ice melt conditions, not the record-pace conditions observed over the past several weeks.

The National Snow and Ice Data Center and NASA show that as of yesterday (8-23-2012) the sea ice extent in the Arctic Ocean is already at near record levels. 

This map shows the current area of the Arctic Ocean covered by at least 15% sea ice as of 8-23.

If you follow my blog you've certainly seen maps like this before.  The white area shows sea ice cover, while the orange line shows the historical average (1979-2000) sea ice cover for this date.  As you can see, the amount of sea ice currently existing in the Arctic is WAY below average, and it has been for the past several years. 


What makes this year different, however, is the rate and extent of sea ice melt - it's going crazy!

Normally the Arctic reaches maximum sea ice melt sometime in mid to late September.  The graph below shows some interesting things.  The dark gray line shows the historical rate of Arctic sea ice melt (1979-2000).  The light gray area aound that line shows + 2 standard deviations (i.e., the range that contains 95% of all sea ice extent observations during that 1979-2000 time period).  The dashed green line shows the pattern of sea ice melt during the previous record year, 2007.  The blue line shows the pattern of sea ice melt this year, 2012. 


As you can see, the sea ice extent in the Arctic is already within a hair's breadth of setting a new sea ice melt record.  That this would happen is not a surprise to climate scientists anywhere...what IS a surprise, though, is how early we reached this mark this year.  We are still anywhere from two to three weeks from the date when we observe the maximum sea ice melt for a given year. 

As for the record for this date, the sea ice melt for 2012 is somewhere between 500,000 km2 and 750,000 km2 greater (that's that much less ice) than in the previous record year of 2007!  Only time will tell now by how much the old record will be broken, but if this year's pattern holds it could be more than a record-breaking year, it could be a record-smashing year.

I'll keep you posted as the melt season progresses.

Friday, August 17, 2012

Have we passed a tipping point? 2012 Arctic sea ice melt is going like mad!

I don't have long, but I just want to get this out there.  When I checked in with the state of the Arctic Ocean sea ice melt I was surprised and shocked to see that the sea ice extent is rapidly closing in on the record sea ice melt observed in 2007.  That the 2007 record would be broken eventually is not the surprising thing.  The  surprising thing is that we are still weeks away from the traditional sea ice minimum (1979-2000 data) and nearly a month from the 2007 sea ice minimum date near mid Sept.

Who knows how much sea ice cover we are likely to lose before mid-Sept?

By my rough calculations based on this map, the 1979-2000 baseline sea ice extent for this date is 7.75 million square kilometers, the previous record for this date (in 2007) was about 5.3 million square kilometers, and the current observed sea ice extent is about 4.8 million square kilometers!  That's half a million square kilometers of sea ice LESS than we observed during the previous record set in 2007.

The 2012 data represent only one year's observation, and as such does not constitute  trend, but the rapidity of this year's melt, together with an Arctic cyclonic storm that normally tends to slow sea ice melt that instead accelerated it, gives me reason for concern.  (For more info on this, visit http://nsidc.org/arcticseaicenews/).

North America has had record heat through the spring and summer of 2012, a massive Greenland ice sheet has been reported that is well beyond anything previously observed, and eastern Europe and other regions of the world also report much warmer than average temperatures.

Unless there is a drastic change in Arctic conditions in the next few days we will almost certainly see a new record sea ice melt in the Arctic Ocean.

The good news is that a recent report from the United States Energy Information Administration (http://www.eia.gov/todayinenergy/detail.cfm?id=7350) stated that national CO2 emissions through the early part of 2012 were down to the level of 1992 emissions - mainly due to power plants switching to available, cleaner burning natural gas.  Still, this concerns me, because with even this reduction we are seeing record temperatures, etc.  I am hopeful, though, that this trend of decreased emissions will continue and mitigate climate change, if possible.

So I pose the question, have we passed a tipping point?  Only time will tell...

Monday, July 9, 2012

Arctic Sea Ice - June 2012 : Sliding down a slippery slope

The data are in from the National Snow and Ice Data Center (NSIDC.org) for the month of June, 2012.  By this time, if you have been keeping an eye on the Arctic (yeah, I know, not many people do, but still),  it should come as no surprise that the rate of sea ice melt is increasing.  

This graph from the NSIDC shows the average sea ice cover in the Arctic Ocean during the month of June for each year between 1978 and 2012...that's 34 years of data.  

There is quite a bit of year to year variability in sea ice cover, you should expect this when you look at any natural system including everything from your heart rate to ice cover in the Arctic Ocean.  

In climatology we do not look at year to year differences.  Instead we look for long-term trends that may exist in the data.  It's best when you have at least 30 years of data. 

These data show a continuing trend decreasing average sea ice cover for the month of June.  To all the people out there who enjoy contending that there is no significant climate change (i.e., global warming) happening, you don't have to believe me, just look at the data.

Like Daniel Patrick Moynihan, congressman and diplomat, once said, "Everyone is entitled to his own opinion, but not to his own facts."  These data are some of the compelling facts.


Are there other compelling observation?

Yes there are...how about these?

Changes in the amount of ice cover on Greenland...this figure shows a recent trend of decreasing ice cover over the past 10 years..perhaps not a long enough data set to be compelling by itself, but the data suggest that a significant shift is happening...the result of ice melt on Greenland. 


This set of maps shows the age of sea ice in the Arctic.  The lighter the color, the older and thicker the ice is.  1987 on the left and 2011 on the right.  The observation here is that there is less old (thick) sea ice than there used to be.  Younger ice is thinner and melts faster in the spring/summer.


This map compares average land and surface temperatures in May 2012 to the average land and sea temperatures from 1971-2000.  The observation here is that the earth is getting warmer almost everywhere, especially in the northern high latitudes.  OK, so why isn't the North Pacific getting warmer?  That is where deepwater currents are pushed back to the surface, and this cold deep water keeps that ocean basin cooler than the others.

This set of graphs show that at the global level, both the land and the oceans are warming.


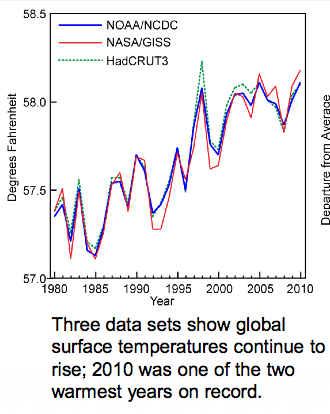
These data show what has happened with global average temperature over the past 30 years...again, there is year-to-year variability which is to be expected, but the overall trend is that things are getting warmer.


What about temperature changes in the USA?  This map shows changes in temperature when you subtract the average July maximum temperature for 1971-2000 from the average July temperature for 1981-2000.  The observation is that the western USA is warming significantly, and there is slight cooling in the heartland.


When we look at the same comparison for Winter temperatures though, we see SIGNIFICANT warming across the entire northern tier of states.  In over words, on average, winters are not as cold as they used to be, especially the farther north you go.


These temperature changes also affect precipitation.  Anyone living in the mountain west or southwest can tell you that less rain has been falling over the past years.  The heartland, though, is getting more precipitation.  Changing air temps affect how much water vapor it can hold, that that affects shifts in regional precipitation.


Lastly (for this posting) sea levels are rising.  This is case along most of our coastlines.  Oceanographers have concluded that most of the sea level rise that has occurred so far is the result of thermal expansion...ocean water getting warmer and less dense...rather than the result of ice caps melting...though sea levels will rise even more and faster once that speeds up.

OK, so why does sea level appear to be going down in some areas (e.g., Alaska)?  Those are areas where tectonic forces are pushing the land up faster than sea level is rising.  So it's not that sea levels aren't rising there, it's just that the land is being pushed up faster than sea levels are rising...so it's a relative change.


When you combine the indicators: land and sea average temperatures, ice cap melt area, Arctic Ocean sea ice melt, changes in latitudinal temperatures, shifts in precipitation, and sea level rise, the only conclusion I can reach is that the global climate is changing - warming.  And so far the only viable explanation that climatologists have been able to come up with that explains why this is happening is the influx of anthropogenic greenhouse gases into the atmosphere starting in the 1800s and continuing through today.  

When we remove the anthropogenic contributions to climate, the remaining natural climate forcing factors alone cannot explain our current observed trend of global warming.

Monday, June 11, 2012

"Canary in a Coal Mine" - Arctic Sea Ice

The spring Arctic Ocean sea ice melt is on!

Scientific predictions, observations, and climate models all lead to the conclusion that signs and effects of global warming will be most extreme near the north pole.  I saw some data this morning that made me sit up and take notice.

We are now in the middle of the most rapid sea ice melt of the year.  That's not the news.  The news is that the most recent data from NASA satellites and the National Snow and Ice Data Center (nsidc.org) show a notable drop in the percentage of the Arctic Ocean and nearby waters over the past few days.

Now a few days do not a trend make, but it is worth keeping an eye on!

This map (courtesy nsidc.org) shows two things.  1) It shows orange lines that indicate the historical average limit of sea ice cover in the Arctic Ocean between 1979 and 2000 for this date, and 2) the white area shows the actual sea ice cover for this date.


Just in case nsidc.org isn't one of your favorite web sites, and you don't routinely follow what's going on in the Arctic (I mean, what normal person does?), here's the scoop.  During the winter of 2011-12 there was a larger than average coverage of sea ice in the Bering Sea (west of Alaska and north of the Aleutian Islands) and it hung around longer than usual.  Today's map shows that the Bering Sea ice is breaking up - FAST!  Also, there is quite a bit of open water showing up north of central Canada and central Russia.  So, why the big news?

If you take a look at the graph below (also courtesy of nsidc.org), you will see the historical average amount of sea ice cover (1979-2000 - dark gray line), the area containing 95% of all historical observations (1979-2000), the current extent of sea ice cover for 2012 (blue line), and the extent of sea ice cover in 2007 - the year we observed the lowest sea ice extent ever (green dashed line).
OK, so what!?

The sea ice cover for 2012 fell easily within the normal range for historical sea ice cover all spring...until now.  During the past few days the sea ice extent has dropped out of the average range, and even below the 2007 extent.

Does this mean we will see record sea ice melt in the Arctic this year?  There's no way to tell at this point, because wind and weather conditions work together to determine the rate of ice melt and where the ice is blown.  But, these data show that we should keep an eye on the Arctic.  Why?  The overall sea ice cover has taken a short-term dip in total cover.  That may be temporary or it may be the beginning of a rapid melt.  Only time will tell on that one.

Why do I follow what's happening in the Arctic Ocean?  The Arctic is the Earth's climate "Canary in a Coal Mine".  Coal miners used to take canaries with them into the mines.  As long as the canaries sang and were healthy, they knew the air was OK.  But when a canary keeled over, passing out or dying, the miners knew it was time to get out.  This is because the canaries were more sensitive to air quality changes than humans.  Similarly, the Arctic is more sensitive to climate change than other areas of the globe, so when we see changes there - and we ARE seeing changes there, it's time to take notice and make changes to mitigate the problem.

What changes are we seeing?  For one, both winter and summer sea ice cover in the Arctic has been dropping significantly for the past 30+ years!

This graph (courtesy nsidc.org) shows the average sea ice cover for the month of May between 1979 and 2012.  While there is quite a bit of noise (year to year up and down) in the data, the long-term trend clearly shows that there is on average less sea ice in the Arctic in the month of May in 2012 than there was 30 years ago.  The slope showing the overall trend is statistically significant.

By the way, if noise in the data concerns you, you need to realize that EVERY natural system contains noise in the data.  This includes everything from local and global average temperatures to your own heart rate.  But if you collect data long enough, and scientists have, trends, if they exist in the data, will become apparent.  The trend in the Arctic is that it is getting warmer up there, and as a result the sea ice cover is dropping year to year.

In other words, the canaries are having a hard time singing.  They may be having a hard time breathing.

Tuesday, May 22, 2012

So what's happening with the Arctic Ocean melt, May 2012?

The annual Spring-Summer Arctic Ocean sea ice melt is well under way.  Like the past several years, the sea ice extent is below the historical average, though by the end of April the ice extent was still the greatest we've seen for this time of year since 2001.  Even so the NSIDC reported that the rate of ice loss is 2.6% per decade.  In other words...there's less ice up there than there used to be at this time of year, and every year there's getting to be less and less of the the floating white stuff!

The Arctic Ocean sea ice reached its maximum extent in mid to late March of this year.  The only time in the last five years when the sea ice extent was this large this late in the spring was in 2010 when it reached it's maximum in at the very end of March/very beginning of April.

Graph courtesy of the National Snow and Ice Data Center at the University of Colorado at Boulder. (NSIDC).  

The reason the sea ice extent is so large this year is that we have had colder than average conditions in the North Pacific.  The white area on the map below shows the extent of sea ice cover (at least 15% cover) as of 5/21/2012.  The orange lines show the 1979-2000 average extent of sea ice.  


Take a look at the Bering Sea, west of Alaska and north of the Aleutian Islands.  There's a LOT more ice there than usual.  The same thing is true for areas west of the the Kamchatka peninsula by coastal Russia and north of Japan.  In the north Atlantic, however, the melt is near normal by eastern Canada and Greenland.  It's ahead of normal, though, north of Scandinavia and northwest of the Kara Sea.  

I can't imagine that the ice in the north Pacific is going to last that much longer, but we'll just have to wait and see.

The take-home message?  The melt is underway, and though it's been slower than usual for May, it's still melting faster than average over all.


Friday, February 10, 2012

The Arctic Ocean continues to warm up...July 2011 had a record sea ice minimum


The amount of the Arctic Ocean covered by sea ice is the lowest on record for the month of July, according to The National Snow and Ice Data Center http://nsidc.org/arcticseaicenews/, located at the University of Colorado, Boulder.

This new sea ice minimum for the month of July exceeds even the previous record set in 2007, but toward the end of July the rate of sea ice melt slowed allowing the minimum from 2007 to once again surpass it.  If you look at the graph below (courtesy of the NSIDC.org) you can see the curves for 2007, the year with the standing record minimum sea ice for the year (dotted line) and the sea ice remaining for 2011 (the blue curve).    The sea ice amount for 2011 was less than in 2007 or any other previous year for which we have satellite data.  The rate of sea ice melt slowed at the end of July 2011, but during the past few days the rate of sea ice melt has picked up again.  Don't be surprised if we see a new sea ice minimum this September, but only weather conditions between now and then will determine that.


This map shows the 1979-2000 average sea ice for this time of year (pink lines) and the current amount of sea ice cover shown in white (also courtesy of NSIDC.org).  If you notice, sea ice melt is progressing particularly rapidly along the Russian and western Canadian and Alaskan shorelines.  It makes me wonder how long it will be this year before the NW passage will be ice free again this year.


This graph (courtesy of NSIDC.org) shows the sea ice extent for July 2011 compared to all previous years since 1979.  It shows clearly that it was a record low sea ice total for the month.  It's interesting that there are some people who look at data like these and say, for example, what happened in 2008!?  2009!?  Those were above the descending trend line?  And they conclude, based on one year's data that global warming is not happening.  In fact, years like 2008 and 2009 are to be expected.  We are, after all, looking at a natural trend, and there is always variability around any natural trend.  It's the overall trend of many years worth of data that need to be considered before a conclusion can be made.  In this case, the data all support the conclusion that we are looking at a trend of decreasing sea ice as the years pass.


In addition, climatologists have also been monitoring the age and thickness of sea ice, in addition to sea ice cover.  This graph shows the percent of sea ice cover on the left-hand image, and the age of ice on the right-hand image.  Scientists have discovered that there is less old (>2-3 year old ice) in the Arctic Ocean than in years past.  What this means is that younger, and therefore thinner ice melts faster than older, thicker ice.  And, since the NSIDC uses a 15% ice cover as a threshold for their measurements for their graphs, etc., this graph is particularly telling when it comes to assessing the status of ice cover in the Arctic Ocean.


If you look at the left-hand map, you will see that only a very small percentage of the Arctic Ocean still has 100% ice cover, and a significant area has only 15% or slightly more.  The prevailing winds and currents tend to cause ice to stack up along the north coasts of Greenland, Baffin Island, and other Canadian Arctic islands, so that is why the ice is thicker and older there.

I, for one, would not be a bit surprised if we saw a record or near record maximum sea ice melt this summer.

Interestingly, sea ice melt has no direct affect on sea levels.  When sea ice melts, it's just like ice cubes in your drink melting.  If you marked the level of fluid containing ice cubes in a glass, you will notice that there is no difference before the ice cubes melt and after they melt, because the total amount of water present in the glass does not change.  What we need to consider when it comes to sea level rise are two things, well, at least these two things: land ice/glacier melt (e.g., the Greenland ice cap), and thermal expansion of water.  As the world's oceans warm, the water becomes slightly less dense, and total volume increases.  We will also see increased evaporation, but the vast majority of evaporated sea water falls directly back on the ocean, so that's probably a negligible effect.

So...so what!?  It's still warming up in the Arctic.

Stay tuned!

(Originally posted 8-9-2011)