Farmers in The Great Plains and the Ohio River Valley were looking forward to a bumper drop this year. That was earlier this spring when unseasonably warm weather allowed them to get into their fields earlier than usual, and the crops got an incredible jump start on the growing season compared to years past. But that didn't last...the rain stopped coming.
This is a video from NOAA (The National Oceanographic and Atmospheric Administration) showing the progression of drought and heat stress on American crops.
If you click this link you can see a report from Weather.com featuring farmers and their concerns and situations: Weather Channel Short Report on Current Drought.
According to my folks who live in Kansas, earlier this spring the wheat harvest was as much as three weeks ahead of schedule, and farmers across America's breadbasket were reporting the same thing - corn, soy, wheat, etc.
Then a drought settled in. It has been warmer than normal and drier than normal across huge areas of the Nation.
This map from the National Climatic Data Center of NOAA (the National Oceanographic and Atmospheric Administration) shows temperature ranks, state by state, across the country. A score of "118" means it's the warmest Jan-June average temperature ever recorded. Just about everyplace except the west coast had either record high temperatures or much higher than normal temperatures.
It's also a LOT drier than normal through the breadbasket of America. The Ohio River Valley and the SW are dry, dry, dry. A score of "1" indicates the driest Jan-June ever.
The map below shows state by state precipitation ranks for the month of June 2012 compared to all previous Junes since the late 1800s. Wyoming is tinderbox dry, as is most of the rest of the mountain west, and the Midwest is also suffering terrible drought.
It's a terrible thing. Pray that the rains return, and quickly.
These high temperatures and drought conditions are short-term weather events, but they are generally consistent with climate change scenarios climatologists have predicted for years. It is statistically difficult to tie a particular weather event to climate change, but one thing is highly certain, that is that the overall trends of observed global climate change over the past few decades make these kinds of weather extremes more likely to occur.
I know, I know, ANOTHER posting on Arctic sea ice!? No, it's more than that.
I guess I just can't help myself, plus the sea ice melt is currently on record pace. The all time record Arctic sea ice melt so far occurred in 2007, but right now there is somewhere between 250,000 and 500,000 square kilometers more open water in the Arctic today than there was at this time in 2007!
The melt is really taking off north of Siberia, in Baffin Bay west of Greenland, and in the Beaufort Sea north of the Canadian Yukon, Northwest Territories, and eastern Alaska. Plus Hudson Bay will soon be ice free, well ahead of historical average melt dates. If this keeps up we will see a new record for ice melt in the Arctic later this summer.
This graph shows the comparison between the area of sea ice cover in the Arctic Ocean between historical averages (1979-2000 - dark gray line), the 2007 record sea ice melt year (dotted green line) and current sea ice cover (blue line).
OK, so what? What can we do to mitigate what is going on with global climate change. While I encourage everyone out there to drive less, walk or bike more, and emit as little carbon as possible, the bottom line is that as individuals we can do little to mitigate the problem. What is desperately needed NOW is for everyone to put pressure on their local, state, and national leaders to take steps to mandate change. It's clear that the small grassroots effort that has been going on for the past few decades is not going to do the job. We need large-scale investment in cleaner, more efficient energy, reductions in carbon emissions, and transportation options.
The science is in, and no matter how much nay-sayers or skeptics want to think or say otherwise, humans are driving the current trend of global warming.
The National Oceanographic and Atmospheric Administrations's Climatic Data Center just released data showing that the months of January through June of 2012 was the warmest ever in the 118 year history of national weather statistics.
This map shows state-by-state rankings of average temperature compared to all other years of Jan-June temperature averages since the late 1800s. A score of "1" means it was the coldest average temperature in the record. A score of "118" means it was the warmest in the temperature record.
This map shows that only two states, Washington and Oregon, showed near normal average temperatures, while the rest of the country experienced above normal to record warmest temperatures. In fact, 30 states reported record warmest temperatures for this 6-month period.
Washington and Oregon were kept cool by Pacific storms that moved onshore, brought cooler temperatures, and much higher than average precipitation. The rest of the country baked.
The national average for precipitation for Jan-June 2012 scored a "16", which means that it was the 16th driest Jan-June on record. A few areas had near record precipitation, such as Coastal Washington, Oregon, northern California, and Minnesota. The Pacific storms explain the rainfall in the NW, and if you recall, there were torrential rainfalls and massive flooding in MN in June. Nevada, the four-corners states, and Wyoming in the meantime experienced near record low precipitation. That's not that surprising - it's an arid part of the country anyway, but look at the Ohio River Valley. These states routinely enjoy storm front after storm front bringing rain needed for agriculture, etc. This Jan-June, however, rainfall was WAY down.
When are we going to wake up? The individual action of a few people here and is simply not enough to make a difference when it comes to mitigating climate change.
This is our time. This is our watch. I believe that our children and grandchildren will rightly hold us responsible for our lack of action, regardless of what any other country or people do.
Carbon emissions are a responsibility of the rich. The rich are the only ones with enough wealth to emit significant amounts of carbon. And when I say rich, I mean people who earn more than $40-50K per year. Where did this number come from? This threshold was identified by two researchers, Pacala and Socolo, of Princeton University. You can learn more about their work by watching this seminar by Dr. Pacala, given a few years ago at Stanford University. It's about an hour long, but it's incredibly fascinating, and their conclusions bear consideration.
The people above the $40-50K personal wealth mark are the people rich enough to own a car, own a house, be materialistic consumers, etc. This is not something we want to hear or like to hear, but it's a serious reality. Economists looking at the emissions of anthropogenic carbon have discovered that the richest 500 million people on the planet, and that the poorest half of the global population (now over 3.5 billion people) are so poor that they emit almost nothing.
Carbon emission is a problem generated by the rich. It is a problem that needs to be shouldered by the rich.
I am sadly convinced that based on what we are doing and on what we are not doing right now, we will not be heroes in future history books. We will be branded as the generation(s) who were more concerned with short-term profits, personal wealth, and lavish lifestyle (i.e., greed) than we were with taking responsibility to be worthy stewards and caretakers of the planet for the benefit of future generations.
I'm pleased to announce that I just received administrative approval to offer, for the first time ever, a field experience in marine biology for BYU-Idaho students. This field experience will be offered during the first block of the Spring Semester 2013.
Students who participate in the experience will enroll in Marine Biology (BIO 314 - 3 credits), Undergraduate Research (BIO 499R - 3 credits) and, 1-credit of Readings in Biology (BIO 401R).
The field portion of the experience will be taught at the Oregon Institute of Marine Biology (OIMB) on Coos Bay, Charleston, OR. The OIMB is the marine biological station of the University of Oregon and has a beautiful campus. I visited the OIMB for 4 days last summer and was extremely impressed by the facilities and the nearby habitats for learning and teaching.
The photo below shows the main entrance to the labs with a research building in the foreground and the administration building in the background.
All of the buildings at the labs share a similar look and style. Very Oregon! Very Beautiful!
This building below houses the dining hall and kitchen. The upper floor is devoted to dormitory space. When it is meal time one of the cooks comes out onto to this building's porch and rings a large, loud, brass bell. You don't want to miss that - or the food!
The photo below is one of the two main teaching lab buildings. Each of these buildings houses two teaching labs. One is a dry lab building, while the other building's labs have running seawater tables. The upper floor of these buildings are also dormitories.
This is the teaching lab our group will use when we are not in the field. The lab accommodates 20 students, and this (and dorm space) is what sets the limit to the number of students who can participate in the trip.
These are the seawater tables that run along one wall of the lab where students can hold marine animals for demonstration purposes, and where lab experiments can be carried out.
If you've spent any time at all at a marine station, you know that there's a volleyball court someplace. Here is the one at OIMB. Volleyball seems to be the sport of marine biologists everywhere.
This photo shows some of the grounds at the OIMB. It's a beautiful and well-kept campus.
This is the OIMB library. It's a very nice place with hard copy holdings focusing mainly on the biota and habitats of the Pacific NW. While you are at the labs, you have access to the University of Oregon's on-line databases, etc. So, it's a pretty sweet deal!
Even the maintenance buildings and motor pool look nice!
If you walk farther up the road, past the main lab buildings you will come to a row of cottages where visiting researchers and visiting instructors are housed. They are named appropriately, Cottages 1-4.
If you continue all the way to the end of the road, passing a housing complex for the US Coast Guard you will reach the Boathouse lecture hall, shown here. This building was built originally to house rescue boats for the Coast Guard. Today it serves as a large lecture hall for the OIMB. Originally, there were large doors that opened, and rescue boats could be run down a sloping pier into the water.
Right next to the Boathouse is the Beach Cottage. This small 2-BR cottage was, according to Craig Young, Director of the OIMB, the first building that was built for the Coast Guard when it was established during the presidency of Theodore Roosevelt in 1908. Before 1908 the US Life Saving Service, the Coast Guard's predecessor patrolled America's beaches and treacherous shores.
Charleston is a working harbor, and the marina/harbor is right across the street from the OIMB. Also anchored in this marina is the OIMB's research vessel, the RV Pluteus. While we were there it was being outfitted with a heavy duty winch in order to allow it to handle the station's newest acquisition, a remotely operated vehicle (ROV) that can go as deep as 600 meters.
This is the RV Pluteus. My students and I will go out on the Pluteus at least once to do plankton tows and bottom dredges to collect samples for analysis in the lab.
The OIMB is right across the street from a commercial cannery and working fishing harbor. This means that the operations across the street are industrial and commercial. In other words, there's not really anyplace to go right next to the marine station, which really helps students focus on their work without a lot of outside distractions. So it's not all bad!
The next few photos show the intertidal zone in front of the Boat House at low tide. We were there during a very nice low tide series. It had to be at least -2.0'. You can also see the remains of the old pier where the rescue boats were run out into the water.
If you continue on beyond the Beach House you will come down over a small cliff onto the OIMB beach. It's a small pocket beach between the shoreline and a breakwater. My daughter Emily is in the foreground.
The rocky intertidal zone beyond the beach looks like it's in great shape - not very trampled. There is LOTS of algae and surf grass, as well as a nice diversity of invertebrate animals. It'll be a nice place to introduce students to this habitat, and it's just a short stroll away from the lab.
I look forward to returning to the OIMB in Spring 2013 with the first group of marine biology field course students.
The data are in from the National Snow and Ice Data Center (NSIDC.org) for the month of June, 2012. By this time, if you have been keeping an eye on the Arctic (yeah, I know, not many people do, but still), it should come as no surprise that the rate of sea ice melt is increasing.
This graph from the NSIDC shows the average sea ice cover in the Arctic Ocean during the month of June for each year between 1978 and 2012...that's 34 years of data.
There is quite a bit of year to year variability in sea ice cover, you should expect this when you look at any natural system including everything from your heart rate to ice cover in the Arctic Ocean.
In climatology we do not look at year to year differences. Instead we look for long-term trends that may exist in the data. It's best when you have at least 30 years of data.
These data show a continuing trend decreasing average sea ice cover for the month of June. To all the people out there who enjoy contending that there is no significant climate change (i.e., global warming) happening, you don't have to believe me, just look at the data.
Like Daniel Patrick Moynihan, congressman and diplomat, once said, "Everyone is entitled to his own opinion, but not to his own facts." These data are some of the compelling facts.
Are there other compelling observation?
Yes there are...how about these?
Changes in the amount of ice cover on Greenland...this figure shows a recent trend of decreasing ice cover over the past 10 years..perhaps not a long enough data set to be compelling by itself, but the data suggest that a significant shift is happening...the result of ice melt on Greenland.
This set of maps shows the age of sea ice in the Arctic. The lighter the color, the older and thicker the ice is. 1987 on the left and 2011 on the right. The observation here is that there is less old (thick) sea ice than there used to be. Younger ice is thinner and melts faster in the spring/summer.
This map compares average land and surface temperatures in May 2012 to the average land and sea temperatures from 1971-2000. The observation here is that the earth is getting warmer almost everywhere, especially in the northern high latitudes. OK, so why isn't the North Pacific getting warmer? That is where deepwater currents are pushed back to the surface, and this cold deep water keeps that ocean basin cooler than the others.
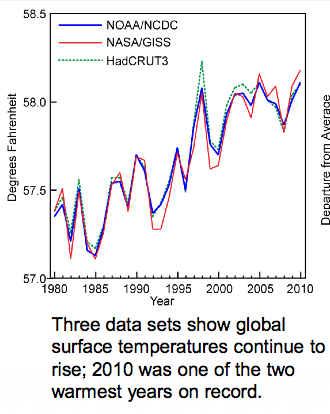
This set of graphs show that at the global level, both the land and the oceans are warming.
These data show what has happened with global average temperature over the past 30 years...again, there is year-to-year variability which is to be expected, but the overall trend is that things are getting warmer.
What about temperature changes in the USA? This map shows changes in temperature when you subtract the average July maximum temperature for 1971-2000 from the average July temperature for 1981-2000. The observation is that the western USA is warming significantly, and there is slight cooling in the heartland.
When we look at the same comparison for Winter temperatures though, we see SIGNIFICANT warming across the entire northern tier of states. In over words, on average, winters are not as cold as they used to be, especially the farther north you go.
These temperature changes also affect precipitation. Anyone living in the mountain west or southwest can tell you that less rain has been falling over the past years. The heartland, though, is getting more precipitation. Changing air temps affect how much water vapor it can hold, that that affects shifts in regional precipitation.
Lastly (for this posting) sea levels are rising. This is case along most of our coastlines. Oceanographers have concluded that most of the sea level rise that has occurred so far is the result of thermal expansion...ocean water getting warmer and less dense...rather than the result of ice caps melting...though sea levels will rise even more and faster once that speeds up.
OK, so why does sea level appear to be going down in some areas (e.g., Alaska)? Those are areas where tectonic forces are pushing the land up faster than sea level is rising. So it's not that sea levels aren't rising there, it's just that the land is being pushed up faster than sea levels are rising...so it's a relative change.
When you combine the indicators: land and sea average temperatures, ice cap melt area, Arctic Ocean sea ice melt, changes in latitudinal temperatures, shifts in precipitation, and sea level rise, the only conclusion I can reach is that the global climate is changing - warming. And so far the only viable explanation that climatologists have been able to come up with that explains why this is happening is the influx of anthropogenic greenhouse gases into the atmosphere starting in the 1800s and continuing through today.
When we remove the anthropogenic contributions to climate, the remaining natural climate forcing factors alone cannot explain our current observed trend of global warming.
As you probably know by now, I have a tendency to blog ad nauseum about global warming and the Arctic Ocean - I admit it, I find that to be an intriguing topic. I'll bet, though, that many of you may be wondering what's been happening with Earth's climate in a broader sense.
In a word: warming! In lots of words? Hang on....
First of all, Robert A. Heinlein probably said it best when he said, "Climate is what you expect, weather is what you get."
Here's a glimpse of recent weather in the USA...
2.1 million acres burned in wildfires
113 million people under extreme heat advisories
2/3 of the country experiencing droughts
Regional flooding in MN and FL
A derecho (a straight-line storm that was 5x more power than a normal thunderstorm) blowing from Chicago to Washington DC
3,215 new daily high temperature records
...and that was just in the month of June!
When we look back a bit farther, that is, since January 2012, we have experienced over 40,000 new daily high temperature records across the USA. Yow! Historically both high and low temperature records were set at about a one to one ratio. But Borenstein (see the source below) reports that between 2000-2010 we observed two new high temp records for each low temp record, and that so far during 2012 we are seeing seven new high temp records for every new low temp record. And, scientific climate models also indicate that by the middle of the century we may see a ration of twenty to one!!!
(Source: "Climate Change: US Heat Waves, Wildfires, and Flooding Are 'What Global Warming Looks Like', by Seth Borenstein, AP 03:04am 07/03/12).
As this article mentions, it is extremely difficult to tie a particular weather event directly to climate change, because weather is twitchy...it's all over the place. One thing that can safely be said, however, is that scientists have predicted these kinds of events to become more likely to occur as climate change proceeds in its warming trend.
In order to see what's going on with climate we need larger sets of observations, ideally at least 30 years' worth in order to see whether any observable trends are emerging.
The following data are from the National Oceanographic and Atmospheric Administration (NOAA) and the National Climactic Data Center (NCDC) 21st Annual State of the Climate Report. (FYI, this report is peer-reviewed and includes work from scientists from 45 countries.)
The first important finding is that the Earth is still getting warmer.
The second important finding is that CO2, an important greenhouse gas, is still on the rise in Earth's atmosphere.
About now some people ask, if CO2 levels are rising, why isn't the Earth heating faster? One of the main reasons is because much of the excess energy is being absorbed by the ocean. This can happen because water has to absorb a LOT of energy before its temperature increases. If it wasn't for the ocean's huge heat capacity, we'd probably already be experiencing runaway warming, not just the gradual warming we see today.
Some people are convinced that the current, observed warming trend is the result of increasing solar output. This is not the case. If you look at the graph below you'll see solar output fluctuating slightly up and down, but there is no long-term trend increasing solar output, so that just doesn't match up with warming we see.
Glaciers are melting
Total greenhouse gas concentrations are increasing
Next, sea level is continuing its slow, but steady rise
Arctic sea ice is melting...its actually melting at about 2x the historical average at the moment.
And there is less spring snow cover than in years past.
In addition, northern latitudes are getting warmer and having longer growing seasons.
When you add all of these things together, what do you get? All of the data together support only one main conclusion...global warming.
It's real, and it's happening. Now what are we going to do about it?


