Thoughts on the ocean, the environment, the universe and everything from nearly a mile high.

Panorama of The Grand Tetons From the top of Table Mountain, Wyoming © Alan Holyoak, 2011

Thursday, August 30, 2012

SHARK RESCUE at Seaside Beach, Seaside, Oregon - 28 August 2012

No, it's not rescuing someone FROM a shark, it's actually rescuing the shark!  Read on...

DISCLAIMER AND WARNING:

First - I need to emphasize something: THIS IS NATURE, NOT DISNEYLAND.  Any wild animal, even one under extreme duress like the one described in this posting, lives according to its own rules not ours.  So if you come across ANY wild animal (injured or not) it's always better to leave it alone and give it plenty of space.  It does not know that you may be trying to do it a favor, and it may defend itself or react unpredictably or dangerously.

Second - Do not try this yourself!  Looking back on my experience, I have to say that I was VERY, VERY lucky.  

On Tuesday, August 28, 2012, my wife and I took a morning walk on Seaside Beach, Seaside, Oregon.  We were out and strolling along the shore before 7am.  Like most people we walked and talked, watched the waves roll in, and kept an eye open for a shell, sand dollar, or something interesting that the tide and waves may have washed up.

For those of you who know Seaside, OR, we were well north of the end of the Prom and had made our turn and were walking south along the beach, it was then about 8:30am.  About 100-150 yards down the beach we saw a young gal standing at the edge of the wave wash zone looking at something in the water.  Whatever it was it had fins, pretty good-sized girth, and was at least a few feet long.  At first I thought it might be a stranded dolphin or porpoise pup.  When I ran over and got close enough to see what it was, I had the shock and thrill of my life.  Luckily I had my wife and camera along!

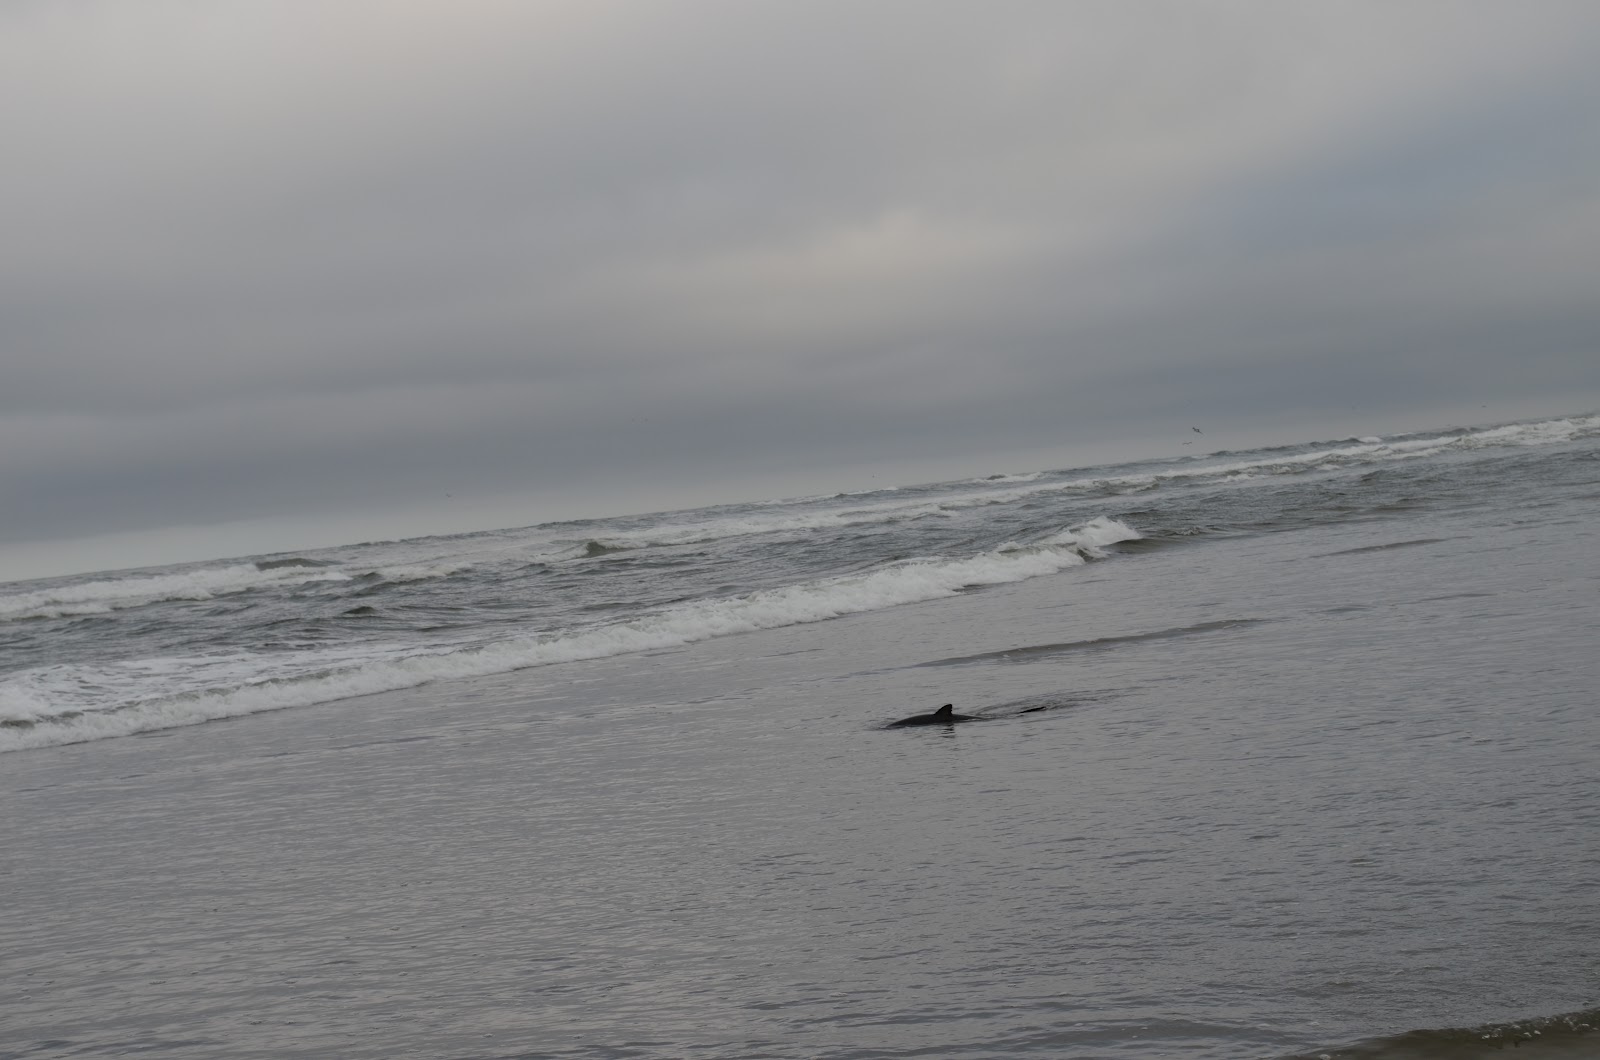
This is what we saw:


This photo shows no scale for size, but based on other photos and using myself in those photos for scale I calculate that that this shark was between 3-4' long, and as you can see, it comes with a full set of teeth.

The shark was being rolled around in the surf and was under obvious and extreme stress, and showing no signs of life.  It was still very flexible though, so perhaps it still had a chance!

At first glance I didn't know exactly what kind of shark this was, but I'd narrowed it down to one of three species: White, Porbeagle (a.k.a. Mackerel), or Salmon shark.  These sharks all belong to Family Lamnidae and have geographic ranges that include the Oregon coast.  Oh, FYI, this family also includes Mako sharks, but this is clearly not one of those!

Anyway, all Lamniid sharks do something called ram ventilation.  That is, they have to swim with their mouths open in order for water to flow over their gills so they can get the oxygen they need.  I had no idea how long this shark had been in the surf, but it was clear that very little water was flowing over its gills - it was almost certainly asphyxiating, and if it couldn't get oxygen soon it would be a goner.

At this point I carefully grabbed it around the caudal peduncle (the part of the body right in front of the tailfin) and carefully hauled it out of the wave wash zone where I could get a look at it.  I was extremely wary that this shark could convulse or thrash around at any time, so I was prepared for that, but it was limp as could be.  This really concerned me.  You can love nature, but IMO it's better to understand and respect it.


This shark was a juvenile.  It had uniform blue-grey coloration above, and white below.  There were no signs of blood or external injury or damage.

I decided that it was probably either a Salmon or Porbeagle shark because the coloration and teeth didn't look right for a white shark of this size.  Juvenile white sharks are much more common along the southern California coast than they are in Oregon, and young whites tend to have a silvery color along their flanks rather than this clearly distinct dark above and white below color pattern you can see in the photo above.

Later, after this experience was all over and we were back in our room, I did some checking and this was definitely a juvenile salmon shark, Lamna ditrops.  Anyway...

At this point there were only two options.  I could just say that since it was showing no signs of life that it was a goner and leave it on the beach, or I could try to get some water going over its gills in an attempt at resuscitation.  Remember, this animal doesn't know that I'm trying to do it a favor, but because it was so lethargic I decided to pick it up and take it back out into the wash zone where there is moving water that is also highly oxygenated - just what it needed!

I picked it up gently but firmly with one hand around the caudal peduncle and another under the pectoral girdle beneath the pectoral fins.  Before I took it back out we took the opportunity to take a few photos.

Here's a shot showing the "business end" of the animal.  This is NOT the time to see "how sharp those teeth really are"!  I was walking on pins and needles.  Even a small shark like this could give you a nasty gash.  BTW, this shark is a female.  You can tell by looking at the paired pelvic fins just in front of my left hand.  They lack projections called claspers that only males have.


OK, one more close up shot and then it's out to the water...


The rust-red discoloration under the lower jaw is a possible indication of lack of oxygen.  This is a sign that the shark was clearly under duress, and unless water starts flowing over the gills soon it'll probably be a goner.


I walked out far enough that the water would be a depth where the shark's mouth would be underwater and I held it, moving its entire body forward and backward in the water as wave after wave came in.  This is similar to what you might do for a trout before you let it go if you are a catch-and-release fisherman.     

Sadly, the shark continued to show no sign of life after some minutes in the water, remaining just like a rag doll.  


I pulled it back up onto the beach (staying well clear of the teeth-end, just in case) and we gave it another look.


This time when we checked it out, it started to show some weak signs of life - flexing its jaws a bit and weak movement of its tail!  By this time there were probably 6-8 onlookers.  

My wife encouraged me to take it back out and try again, and I did.


I look it out into slightly deeper water than I'd been in before and continued trying to get water into the mouth and over the gills.

It still didn't show a lot of signs of life, but I thought, what have I got to lose?  So I gave it a gentle shove, launching it toward deeper water.  Surprisingly it started to beat its tail fin, still weakly, but beating.  We stood and watched it, hoping for it.  It was still swimming weakly, but swimming nevertheless.  It was having a hard time, getting rolled over in the wash zone a couple of times (see the photo series below), but at least it's head was facing into the waves; water flow = life!

In this series of photos you can see the shark getting rolled over a few times in the wash zone.  When you see black, that's its back.  When you see white, that's its belly.


Luckily she managed to get her bearings and make it into deeper water.  If you click on the photo below to see the full-sized image you will be able to see the tips of the dorsal and caudal fins sticking above the water. 


We watched as long as we could, and between 5-10 mins later we couldn't see it any more.  From all indications this was a successful rescue.

FYI, salmon sharks are fish-eaters.  They reportedly prefer salmon.  Their teeth are specialized for this lifestyle.  The teeth are all needle-like, sharp and pointed - good for grabbing and holding a fish, not really so much for biting and slicing - that's the white sharks's game.

Anyway, if you check the web you will see that it is not at all uncommon for salmon sharks, especially juveniles, to get stranded on beaches of Oregon and Washington.

There are a variety of possible reasons why they might get stranded: they could lose their bearings while fishing in shallow water and get rolled up onto the beach; they could be trying to escape from larger sharks (like whites) that are known to feed on this size of shark; or they could be sick and disoriented.  Those are all likely possibilities.  I hope that in this case that the shark was simply disoriented and that she's now fine.

Here's hoping!

Lastly, this is the biggest fish I ever caught!  This is a fish story I'll love telling...

Remember, IT'S NATURE, NOT DISNEYLAND!

And again, remember, I got lucky.  Don't try this yourself!

2012 Arctic sea ice melt sets new record with no signs of slowing down

This is amazing...it's like watching a slow motion train wreck.  You want to look away, but you just can't do it!

The former record Arctic Ocean sea ice melt was set five years ago, in 2007, and though a couple of other years since then looked like they might flirt with setting a new record, none of them really came close.  In October 2007 The National Snow and Ice Data Center reported that the Arctic sea ice had shattered the pre-exisitng record from 2005.  You can read that full report by clicking the link below.

http://nsidc.org/news/press/2007_seaiceminimum/20071001_pressrelease.html

This graph from the NSIDC October 2007 report shows the difference between the sea ice melt in 2005 and 2007.

The dark gray line shows the 1979-2000 satellite data showing the average sea ice extent during those 20 years.  The dashed green line shows the record set in 2005, and the blue line shows the new record that was set in 2007.

The NSIDC analysts concluded that the 2007 record ice melt was the result of a series of weather and other factors including the following:

  • Lower than average sea ice extent at the beginning of the ice melt season
  • Thinner ice than average at the beginning of the ice melt season
  • A persistent high pressure cell over the central Arctic Ocean through much of the melt season.  That high pressure cell meant clearer skies, and increased amount of solar radiation that struck the ice and ocean surface, accelerating melting.
  • Low pressure cells over northern Siberia that produced strong offshore winds that pushed sea ice offshore faster and earlier than normal, plus these winds were warm and promoted further sea ice melt
OK, so what!?

Well, this year, 2012, the Arctic Ocean sea ice melt season still has anywhere from 2 weeks to a month to go, and there is already a new sea ice melt record that from all current indications has the potential to not only exceed, but smash the old record!

This is what the 2012 sea ice melt season looks like so far.

The dark gray line shows the 1979-2000 average, and the dashed green line shows pattern of sea ice melt in 2007, the year of the previous record sea ice melt.  The blue line in this graph shows the sea ice melt pattern for 2012.  If you look at the vertical axis on the left of the graph you can eyeball it and see that the sea ice extent for 29 Aug is probably between 500,000 and 1,000,000 km2 less in 2012 than it was in 2007.  All right, so what were the conditions this year?

The map below shows the maximum sea ice cover of the Arctic Ocean in spring 2012 (18 March 2012). If you look, the sea ice extent is greater than average in the Bering Sea and off Kamchatka.  It reached historical average extents off of the east coast of Greenland and exceeded them off the west coast of Greenland.  At the same time Arctic sea ice cover was below average in the Barents Sea north of Scandinavia and Russia's Kola Peninsula, but not really many other places.


OK, so what conditions existed over the Arctic that led to the current sea ice melt record?

Well, for one thing, there was a strong, cyclonic Arctic low pressure cell that appeared near the end of the first week of August.  Analysts at the NSIDC reported that this type of storm normally spreads sea ice out and slows the rate of sea ice melt, but if you look at the graph of 29 Aug 2009 for the first part of August 2012 the rate of sea ice melt actually increased instead of decreasing!  This is completely counterintuitive when compared to the effects of similar conditions in the past.

This map shows the high and low pressure cells that produced that Arctic storm.  The low pressure cell in the middle of the map should have been a place where cloud cover formed, blocked solar radiation, and produced winds that slowed the compacting of sea ice and sea ice melt...but that didn't happen.


So, to sum up, there was a lot of ice when the melt season began, conditions conducive to rapid sea ice melt were not particularly evident in this year's weather patterns, but a record-setting sea ice melt has already occurred and there are still at least two weeks and perhaps as many as four weeks to go in the ice melt season.

This is what the sea ice cover looked like as of 29 August 2012.  Remember that the orange lines represent the average area of sea ice cover from 1979-2000.  The map speaks for itself.


The only thing we can do now is sit back and see how long the sea ice melt will continue, and by how much the old sea ice melt record will be broken.  Sigh...

Friday, August 24, 2012

Are you kidding me!? Arctic sea ice melt is already at a near record level and still going strong

In 2007 the rate and extent of sea ice melt shocked the world of climate scientists.  That year an unusual set of weather events combined to produce a record sea ice melt in the Arctic Ocean.  This year, 2012, that record is almost certainly going to be broken, if not shattered.  What makes this VERY unusual is that the recent conditions in the Arctic, including an Arctic cyclonic storm, normally produce slower sea ice melt conditions, not the record-pace conditions observed over the past several weeks.

The National Snow and Ice Data Center and NASA show that as of yesterday (8-23-2012) the sea ice extent in the Arctic Ocean is already at near record levels. 

This map shows the current area of the Arctic Ocean covered by at least 15% sea ice as of 8-23.

If you follow my blog you've certainly seen maps like this before.  The white area shows sea ice cover, while the orange line shows the historical average (1979-2000) sea ice cover for this date.  As you can see, the amount of sea ice currently existing in the Arctic is WAY below average, and it has been for the past several years. 


What makes this year different, however, is the rate and extent of sea ice melt - it's going crazy!

Normally the Arctic reaches maximum sea ice melt sometime in mid to late September.  The graph below shows some interesting things.  The dark gray line shows the historical rate of Arctic sea ice melt (1979-2000).  The light gray area aound that line shows + 2 standard deviations (i.e., the range that contains 95% of all sea ice extent observations during that 1979-2000 time period).  The dashed green line shows the pattern of sea ice melt during the previous record year, 2007.  The blue line shows the pattern of sea ice melt this year, 2012. 


As you can see, the sea ice extent in the Arctic is already within a hair's breadth of setting a new sea ice melt record.  That this would happen is not a surprise to climate scientists anywhere...what IS a surprise, though, is how early we reached this mark this year.  We are still anywhere from two to three weeks from the date when we observe the maximum sea ice melt for a given year. 

As for the record for this date, the sea ice melt for 2012 is somewhere between 500,000 km2 and 750,000 km2 greater (that's that much less ice) than in the previous record year of 2007!  Only time will tell now by how much the old record will be broken, but if this year's pattern holds it could be more than a record-breaking year, it could be a record-smashing year.

I'll keep you posted as the melt season progresses.

Friday, August 17, 2012

Have we passed a tipping point? 2012 Arctic sea ice melt is going like mad!

I don't have long, but I just want to get this out there.  When I checked in with the state of the Arctic Ocean sea ice melt I was surprised and shocked to see that the sea ice extent is rapidly closing in on the record sea ice melt observed in 2007.  That the 2007 record would be broken eventually is not the surprising thing.  The  surprising thing is that we are still weeks away from the traditional sea ice minimum (1979-2000 data) and nearly a month from the 2007 sea ice minimum date near mid Sept.

Who knows how much sea ice cover we are likely to lose before mid-Sept?

By my rough calculations based on this map, the 1979-2000 baseline sea ice extent for this date is 7.75 million square kilometers, the previous record for this date (in 2007) was about 5.3 million square kilometers, and the current observed sea ice extent is about 4.8 million square kilometers!  That's half a million square kilometers of sea ice LESS than we observed during the previous record set in 2007.

The 2012 data represent only one year's observation, and as such does not constitute  trend, but the rapidity of this year's melt, together with an Arctic cyclonic storm that normally tends to slow sea ice melt that instead accelerated it, gives me reason for concern.  (For more info on this, visit http://nsidc.org/arcticseaicenews/).

North America has had record heat through the spring and summer of 2012, a massive Greenland ice sheet has been reported that is well beyond anything previously observed, and eastern Europe and other regions of the world also report much warmer than average temperatures.

Unless there is a drastic change in Arctic conditions in the next few days we will almost certainly see a new record sea ice melt in the Arctic Ocean.

The good news is that a recent report from the United States Energy Information Administration (http://www.eia.gov/todayinenergy/detail.cfm?id=7350) stated that national CO2 emissions through the early part of 2012 were down to the level of 1992 emissions - mainly due to power plants switching to available, cleaner burning natural gas.  Still, this concerns me, because with even this reduction we are seeing record temperatures, etc.  I am hopeful, though, that this trend of decreased emissions will continue and mitigate climate change, if possible.

So I pose the question, have we passed a tipping point?  Only time will tell...

Tuesday, August 7, 2012

Global Climate Update - summer 2012

I know that you're probably miffed at me because I've been slacking off for the past couple of weeks, and I haven't given you any Arctic sea ice or national or global climate updates.  Well, everyone deserves a break, but now that we managed to survive July, and some of the agencies and labs that track climate trends have reported in, it's time to take a look at what's going on out there.

First of all...IT'S HOT OUT THERE!

This map shows the global temperature anomalies for June 2012 compared to a long-term average of temperature data from 1971-2000.  The bigger the red circle, the hotter it is compared to the historical average, and the bigger the blue dot the cooler.

Yep, almost everywhere, especially almost everywhere on land, is hot!  And in most of the high north latitudes as much as 4-5oC hotter than the historic average.  Localized weather conditions are keeping a few places, like Australia, central Africa. and the North Pacific cooler than usual, but everywhere else it's hot, dang hot!

Yeah, like you needed a map from NOAA (The National Oceanographic and Atmospheric Administration) to tell you that.

Next let's take a look at the United States drought index.  This map is provided courtesy of the USDA (Dept of Agriculture and other govt. agencies that track weather, climate, and their effects on agriculture.

This map shows that state of drought conditions across the United States as of 31 July 2012.  Yep, the darker red the color, the more intense the drought.  Scarily, the most intensive drought conditions stretch across the country's bread basket of the Great Plains states.


I just talked with my folks who live in Wichita, KS, and they say that the corn around there is in REALLY bad shape.  They told me that the leaves are dry and brittle, just hanging down on the stalks.  They also told me that while traveling to Oklahoma City recently that they saw a thermometer that said 118oF!  Yow!  

Only the Pacific NW and isolated parts of other states seem to be spared this year's summer drought.

All right, let's see what's brewing up north - our "canary in a coal mine" for global climate.

First stop - Greenland.  This graph from the National Snow and Ice Data Center (NSIDC.org) shows a disturbing development.  The puple-ish area at the bottom of the graph shows the historical average including data from 1980-1999 of ice melt area on Greenland.  The other colors show observed ice melt in 2010 (blue), 2011 (green), and 2012 (red) through the middle of July.  This year the ice melt area has shot off the charts, uncovering between 4-5x the normal amount of land area uncovered by melting ice.  Other data (not shown here) show that Greenland's ice cap is getting thinner around the edges and thicker in the middle, but that all in all ice is melting faster than it is being added.  The bottom line?  The Greenland ice cap is starting to shrink.
OK, what about the Arctic Ocean 2012 spring and summer sea ice melt?  The graph below shows the historical average amount of ice melt from the years 1979-2000, and the ice melt trends for 2007-2012.  The ice melt in 2007 was the most extreme recorded so far, but if you look at the graph again you will see that the sea ice melt trend for 2012 is nearly identical to that seen in 2007 at this point in the year (8-5-2012).  There is no way to know if this rapid rate if ice melt will continue, but if it does we may well be looking at a new record sea ice melt.  It is, at least, but not by much, the record for Arctic sea ice melt for this date.

The amount of sea ice remaining in the Arctic ocean is currently about 2 MILLION square kilometers less than the 1979-2000 historical average.  Now that's worth noting.

This map shows the current extent of sea ice cover (at least 15% cover) in the Arctic Ocean.  The NW Passage has opened up again west of Baffin Island, and sea ice melt is greatly ahead of historical trends (the orange lines) north of most of both Alaska and Siberia.  OK...so what?
  

This graph shows what has become a predictable trend of decreasing sea ice cover.  July 2012 is a close second to 2011 as the all-time lowest sea ice cover for this month.  The downward trend of sea ice cover, i.e., increasing trend of sea ice melt continues...


Climatologists who study the patterns and processes of climate and climate change developed a set of scenarios regarding Arctic sea ice melt.  This graph shows two scenarios starting in 1900 and running through 2100.  The blue line indicates a scenario of "business as usual" greenhouse gas emissions, and the red line represents an updated scenario based on an improved model, but the black line, that represents observed sea ice extent data for the month of September 1952-2011 shows sea ice cover declining at an even faster rate than even the latest model scenario.

How different are the observed data and the model scenarios?  The original "business as usual" model scenario indicates that the sea ice melt over the past few years is happening 40-50 years sooner than the original scenario showed.  And the observed sea ice melt is still proceeding 10-20 years faster than the newer model suggests should be happening.


No matter how you slice it, it's warmer out there now than it used to be.  It's warmer on land, ice is melting faster on Greenland, and sea ice is melting faster in the Artctic than it used to.  The bottom line is that, believe it or not, like it not, the global climate is changing - warming.

One last thing...what about the Antarctic?  Sea ice formation and melting appears to be proceeding normally there, but this is south polar pattern is maintained due to unique currents and oceanographic factors around the Antarctic continent that keep it colder than anyplace else on the planet.  In short, the Antarctic East Wind Drift Current and Antarctic West Wind Drift Current create the Antarctic Divergence that keeps supercooled water inshore AND moves supercooled water north away from Antarctica.  This supercooled water is denser and will not readily mix with the warmer, less dense water masses found in the southern Indian, Atlantic, and Pacific Oceans.  So the Antarctic is the exception to what is happening globally.  But to explain this more fully would require another complete posting.