According to the NSIDC this was the first time since 1979 (the first satellite coverage of Greenland) that every point on the entire Greenland ice cap reached melt conditions for at least part of the melt season. This is shocking news, since some of the ice cap is over 2 miles above sea level, and should be high enough in both latitude and altitude to stay below freezing all year long. But, alas, temperatures climbed above freezing everywhere on the ice cap.
The graph below shows the historical average percentage of the Greenland ice cap that experienced melt conditions on a daily basis. You should note that historically essentially no ice melts from Jan to April and Oct through December, and that the historical melt season starts in April and runs through September. The data also show that on average only about 25% of the ice cap experiences melt conditions.
The red line in the graph below shows the 2012 melt extent. Compare it to dashed blue line showing the historical average. What should you be seeing here? (Continued below the graph.)
You will, I hope, notice a few things. One is that there was a spring melt event in late March where more than 10% of the ice cap reached melt conditions. This was at least two months earlier than the historical average reaches that extent. It was a short event, but it occurred all the same. The biggest thing you should see is that the melt extent during the summer reached up 90%. Historically only about 25% of the ice cap experiences melt conditions. In short, the 2012 Greenland ice cap melt exceeded anything observed so far in modern times.
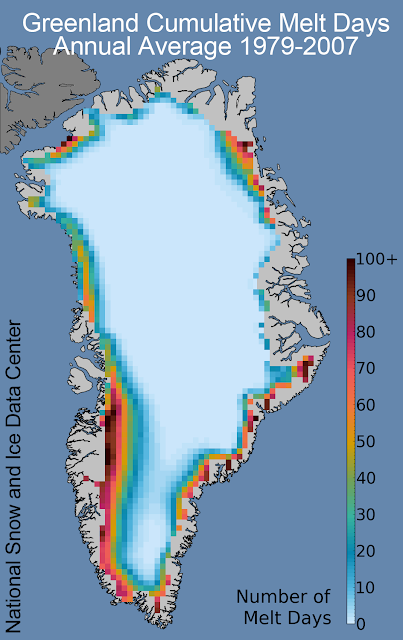
The map below shows the 1979-2007 average of the cumulative number of days areas of the ice cap reached melt conditions. Historically, the north edge of the ice cap experienced about 10-15 days of melt conditions. The central east coast had even fewer than that. And the SW coast experienced the most. Now let's take a look at the cumulative number of melt days across the ice cap during 2012...look at the second map down.
The map below shows a frightening increase in the number of melt days even in regions mainly resistant to melting in previous years. For example, the northern edge of the ice cap experienced 100+ days of ice melt, the central east coast had 50-60 days, and the SW coast also had 100+ days. In fact, all ice cap edges experienced shocking numbers of days of melt conditions during 2012. And, as mentioned above, even the center of the ice cap reached melt conditions for a few days.
The map below shows air temperature anomalies for June-August 2012 compared to historical averages. What this means is that the closer a region is to the red end of the scale, the warmer is is compared to historical averages, and the closer it is to the purple end, the cooler it was. The map shows that the entire ice cap experienced increased temperatures compared to the historical average.
The SW coast was especially hard-hit with temperatures in the +3.0oC range, while the center of the ice cap had temperatures that were 1oC to 2oC above average. Nowhere in Greenland experienced below average temperatures during this time period.
The bottom line is that during 2012 Greenland's ice cap experienced unprecedented ice melt conditions compared to data from the satellite record (since 1979).
Should we be concerned about this? I am.
Well, there is a chance that this could have been an isolated warmer than average year, but all other data from the Arctic in terms of temperatures, sea ice cover, etc., indicates that this kind of extreme melt year will most likely become more frequent if the forcing factors driving climate change are not mitigated.
Climatologists and oceanographers predict that if the entire Greenland ice cap were to melt, we would most likely see global sea level rise of about +7.0 meters (that's over 20 ft). That would be catastrophic and make the flooding that occurred during Hurricane Sandy look like a nice day in the park.
Come on people, it's time to get to work doing things that will mitigate the effects of climate change.
That's my 2 cents' worth...


