Thoughts on the ocean, the environment, the universe and everything from nearly a mile high.

Panorama of The Grand Tetons From the top of Table Mountain, Wyoming © Alan Holyoak, 2011
Showing posts with label Greenland ice melt. Show all posts

Tuesday, August 7, 2012

Global Climate Update - summer 2012

I know that you're probably miffed at me because I've been slacking off for the past couple of weeks, and I haven't given you any Arctic sea ice or national or global climate updates.  Well, everyone deserves a break, but now that we managed to survive July, and some of the agencies and labs that track climate trends have reported in, it's time to take a look at what's going on out there.

First of all...IT'S HOT OUT THERE!

This map shows the global temperature anomalies for June 2012 compared to a long-term average of temperature data from 1971-2000.  The bigger the red circle, the hotter it is compared to the historical average, and the bigger the blue dot the cooler.

Yep, almost everywhere, especially almost everywhere on land, is hot!  And in most of the high north latitudes as much as 4-5oC hotter than the historic average.  Localized weather conditions are keeping a few places, like Australia, central Africa. and the North Pacific cooler than usual, but everywhere else it's hot, dang hot!

Yeah, like you needed a map from NOAA (The National Oceanographic and Atmospheric Administration) to tell you that.

Next let's take a look at the United States drought index.  This map is provided courtesy of the USDA (Dept of Agriculture and other govt. agencies that track weather, climate, and their effects on agriculture.

This map shows that state of drought conditions across the United States as of 31 July 2012.  Yep, the darker red the color, the more intense the drought.  Scarily, the most intensive drought conditions stretch across the country's bread basket of the Great Plains states.


I just talked with my folks who live in Wichita, KS, and they say that the corn around there is in REALLY bad shape.  They told me that the leaves are dry and brittle, just hanging down on the stalks.  They also told me that while traveling to Oklahoma City recently that they saw a thermometer that said 118oF!  Yow!  

Only the Pacific NW and isolated parts of other states seem to be spared this year's summer drought.

All right, let's see what's brewing up north - our "canary in a coal mine" for global climate.

First stop - Greenland.  This graph from the National Snow and Ice Data Center (NSIDC.org) shows a disturbing development.  The puple-ish area at the bottom of the graph shows the historical average including data from 1980-1999 of ice melt area on Greenland.  The other colors show observed ice melt in 2010 (blue), 2011 (green), and 2012 (red) through the middle of July.  This year the ice melt area has shot off the charts, uncovering between 4-5x the normal amount of land area uncovered by melting ice.  Other data (not shown here) show that Greenland's ice cap is getting thinner around the edges and thicker in the middle, but that all in all ice is melting faster than it is being added.  The bottom line?  The Greenland ice cap is starting to shrink.
OK, what about the Arctic Ocean 2012 spring and summer sea ice melt?  The graph below shows the historical average amount of ice melt from the years 1979-2000, and the ice melt trends for 2007-2012.  The ice melt in 2007 was the most extreme recorded so far, but if you look at the graph again you will see that the sea ice melt trend for 2012 is nearly identical to that seen in 2007 at this point in the year (8-5-2012).  There is no way to know if this rapid rate if ice melt will continue, but if it does we may well be looking at a new record sea ice melt.  It is, at least, but not by much, the record for Arctic sea ice melt for this date.

The amount of sea ice remaining in the Arctic ocean is currently about 2 MILLION square kilometers less than the 1979-2000 historical average.  Now that's worth noting.

This map shows the current extent of sea ice cover (at least 15% cover) in the Arctic Ocean.  The NW Passage has opened up again west of Baffin Island, and sea ice melt is greatly ahead of historical trends (the orange lines) north of most of both Alaska and Siberia.  OK...so what?
  

This graph shows what has become a predictable trend of decreasing sea ice cover.  July 2012 is a close second to 2011 as the all-time lowest sea ice cover for this month.  The downward trend of sea ice cover, i.e., increasing trend of sea ice melt continues...


Climatologists who study the patterns and processes of climate and climate change developed a set of scenarios regarding Arctic sea ice melt.  This graph shows two scenarios starting in 1900 and running through 2100.  The blue line indicates a scenario of "business as usual" greenhouse gas emissions, and the red line represents an updated scenario based on an improved model, but the black line, that represents observed sea ice extent data for the month of September 1952-2011 shows sea ice cover declining at an even faster rate than even the latest model scenario.

How different are the observed data and the model scenarios?  The original "business as usual" model scenario indicates that the sea ice melt over the past few years is happening 40-50 years sooner than the original scenario showed.  And the observed sea ice melt is still proceeding 10-20 years faster than the newer model suggests should be happening.


No matter how you slice it, it's warmer out there now than it used to be.  It's warmer on land, ice is melting faster on Greenland, and sea ice is melting faster in the Artctic than it used to.  The bottom line is that, believe it or not, like it not, the global climate is changing - warming.

One last thing...what about the Antarctic?  Sea ice formation and melting appears to be proceeding normally there, but this is south polar pattern is maintained due to unique currents and oceanographic factors around the Antarctic continent that keep it colder than anyplace else on the planet.  In short, the Antarctic East Wind Drift Current and Antarctic West Wind Drift Current create the Antarctic Divergence that keeps supercooled water inshore AND moves supercooled water north away from Antarctica.  This supercooled water is denser and will not readily mix with the warmer, less dense water masses found in the southern Indian, Atlantic, and Pacific Oceans.  So the Antarctic is the exception to what is happening globally.  But to explain this more fully would require another complete posting.  

Monday, July 9, 2012

Arctic Sea Ice - June 2012 : Sliding down a slippery slope

The data are in from the National Snow and Ice Data Center (NSIDC.org) for the month of June, 2012.  By this time, if you have been keeping an eye on the Arctic (yeah, I know, not many people do, but still),  it should come as no surprise that the rate of sea ice melt is increasing.  

This graph from the NSIDC shows the average sea ice cover in the Arctic Ocean during the month of June for each year between 1978 and 2012...that's 34 years of data.  

There is quite a bit of year to year variability in sea ice cover, you should expect this when you look at any natural system including everything from your heart rate to ice cover in the Arctic Ocean.  

In climatology we do not look at year to year differences.  Instead we look for long-term trends that may exist in the data.  It's best when you have at least 30 years of data. 

These data show a continuing trend decreasing average sea ice cover for the month of June.  To all the people out there who enjoy contending that there is no significant climate change (i.e., global warming) happening, you don't have to believe me, just look at the data.

Like Daniel Patrick Moynihan, congressman and diplomat, once said, "Everyone is entitled to his own opinion, but not to his own facts."  These data are some of the compelling facts.


Are there other compelling observation?

Yes there are...how about these?

Changes in the amount of ice cover on Greenland...this figure shows a recent trend of decreasing ice cover over the past 10 years..perhaps not a long enough data set to be compelling by itself, but the data suggest that a significant shift is happening...the result of ice melt on Greenland. 


This set of maps shows the age of sea ice in the Arctic.  The lighter the color, the older and thicker the ice is.  1987 on the left and 2011 on the right.  The observation here is that there is less old (thick) sea ice than there used to be.  Younger ice is thinner and melts faster in the spring/summer.


This map compares average land and surface temperatures in May 2012 to the average land and sea temperatures from 1971-2000.  The observation here is that the earth is getting warmer almost everywhere, especially in the northern high latitudes.  OK, so why isn't the North Pacific getting warmer?  That is where deepwater currents are pushed back to the surface, and this cold deep water keeps that ocean basin cooler than the others.

This set of graphs show that at the global level, both the land and the oceans are warming.


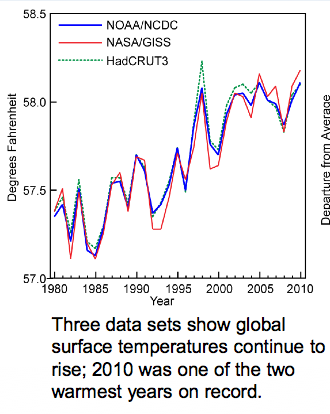
These data show what has happened with global average temperature over the past 30 years...again, there is year-to-year variability which is to be expected, but the overall trend is that things are getting warmer.


What about temperature changes in the USA?  This map shows changes in temperature when you subtract the average July maximum temperature for 1971-2000 from the average July temperature for 1981-2000.  The observation is that the western USA is warming significantly, and there is slight cooling in the heartland.


When we look at the same comparison for Winter temperatures though, we see SIGNIFICANT warming across the entire northern tier of states.  In over words, on average, winters are not as cold as they used to be, especially the farther north you go.


These temperature changes also affect precipitation.  Anyone living in the mountain west or southwest can tell you that less rain has been falling over the past years.  The heartland, though, is getting more precipitation.  Changing air temps affect how much water vapor it can hold, that that affects shifts in regional precipitation.


Lastly (for this posting) sea levels are rising.  This is case along most of our coastlines.  Oceanographers have concluded that most of the sea level rise that has occurred so far is the result of thermal expansion...ocean water getting warmer and less dense...rather than the result of ice caps melting...though sea levels will rise even more and faster once that speeds up.

OK, so why does sea level appear to be going down in some areas (e.g., Alaska)?  Those are areas where tectonic forces are pushing the land up faster than sea level is rising.  So it's not that sea levels aren't rising there, it's just that the land is being pushed up faster than sea levels are rising...so it's a relative change.


When you combine the indicators: land and sea average temperatures, ice cap melt area, Arctic Ocean sea ice melt, changes in latitudinal temperatures, shifts in precipitation, and sea level rise, the only conclusion I can reach is that the global climate is changing - warming.  And so far the only viable explanation that climatologists have been able to come up with that explains why this is happening is the influx of anthropogenic greenhouse gases into the atmosphere starting in the 1800s and continuing through today.  

When we remove the anthropogenic contributions to climate, the remaining natural climate forcing factors alone cannot explain our current observed trend of global warming.